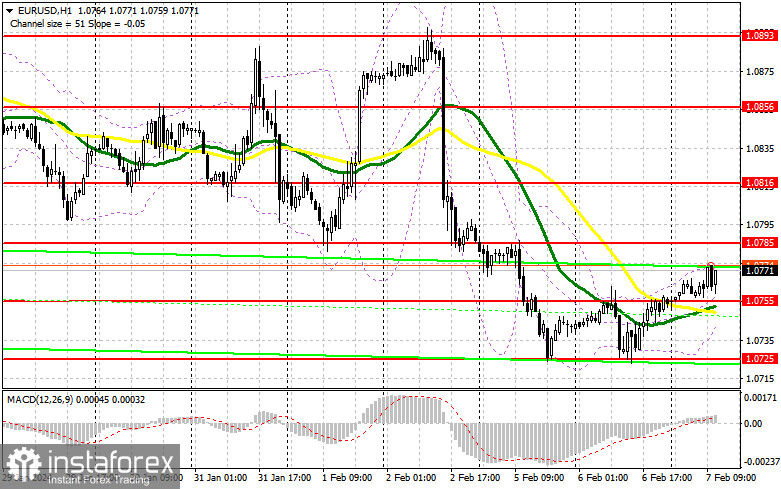
In my morning forecast, I emphasized the level of 1.0755 and planned to make decisions on market entry based on it. Let's take a look at the 5-minute chart and analyze what happened. A decline occurred, but due to very low market volatility, which was about 20 points, we did not reach the test of 1.0755. For this reason, there were no market entry signals. The technical picture remained unchanged for the second half of the day.

To open long positions on EUR/USD, the following is required:
Data on the reduction of industrial production in Germany limited the upside potential of the pair, as all this indicates the persisting issues in the flagship economy of the Eurozone. Ahead of us are quite mediocre U.S. statistics in the form of the trade balance and consumer credit volume. Therefore, I recommend focusing attention on the speeches and interviews of Federal Reserve representatives. Statements from FOMC members Susan M. Collins, Thomas Barkin, and Michelle Bowman are expected. A tendency toward a more accommodative policy will harm the dollar and lead to further growth in risk assets.
As for the strategy for the second half of the day, I will act following the morning forecast: the formation of a false breakout in the area of 1.0755, where moving averages are located, will provide suitable conditions for buying against the trend, expecting further upward correction to around 1.0785 – the upper boundary of the channel. Breaking and updating this range from top to bottom will provide an opportunity to buy with the development of a more powerful upward correction and the prospect of updating 1.0816. The ultimate target will be the maximum at 1.0856, where I will take profit. In case of a decline in EUR/USD and the absence of activity at 1.0755 in the second half of the day, pressure on the pair will return. In this case, I plan to enter the market only after the formation of a false breakout around 1.0725. I will consider opening long positions immediately on the rebound from 1.0696 with the target of an intraday upward correction by 30-35 points.
To open short positions on EUR/USD, the following is required:
Bears attempted to return on weak data but failed to reach even the nearest support at 1.0755. For this reason, it is now better to focus attention on protecting the resistance at 1.0785, the movement toward which may occur at any moment after weak U.S. statistics. Protection and the formation of a false breakout there will indicate the presence of major players in the market, which may lead to a new downward movement of the pair towards 1.0755, thus continuing the development of a new downtrend. Breaking and consolidating below this range, as well as a bottom-up retest, will provide another selling point with the pair collapsing towards 1.0725. The ultimate target will be the minimum at 1.0696, where I will take profit. In case of an upward movement of EUR/USD in the second half of the day and the absence of bears at 1.0785, buyers will continue to play their positions. In this case, I will postpone selling until testing the next resistance at 1.0816. I will also sell there, but only after an unsuccessful consolidation. I plan to open short positions immediately on the rebound from 1.0856 with the target of a downward correction by 30-35 points.
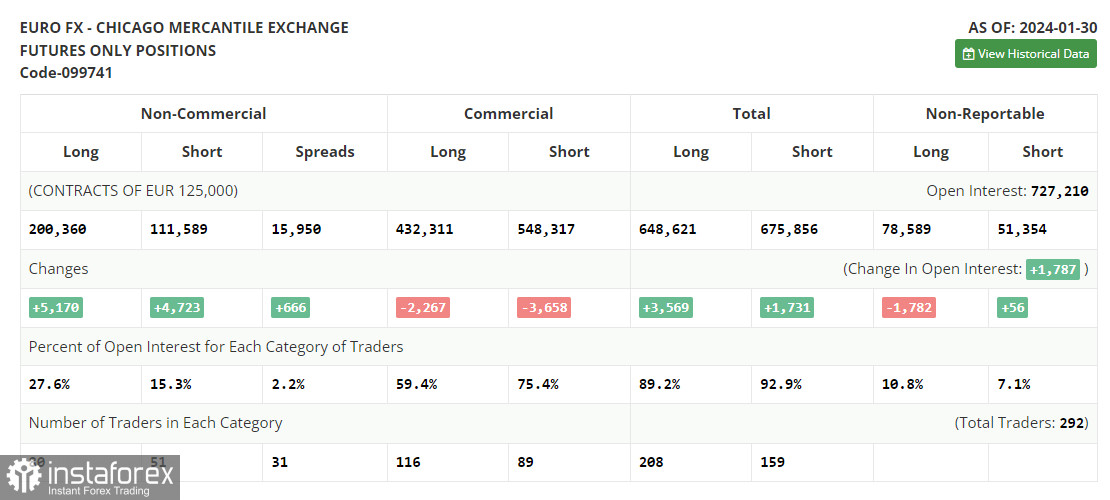
In the Commitment of Traders (COT) report as of January 30, there was an increase in both long and short positions. Obviously, after the Federal Reserve meeting, it became clear that no one intends to change anything yet, and the latest data on the U.S. GDP and labor market indicate that interest rates need to be kept high for as long as possible, as reducing them now could result in another surge of inflationary pressure, which the central bank has been fighting for almost two years. This week promises to be quite calm in terms of statistics, so we can expect the bearish trend in the euro to persist and the strengthening of the U.S. dollar. In the COT report, it is indicated that non-commercial long positions increased by 5,170 to the level of 200,360, while non-commercial short positions increased by 4,723 to the level of 111,589. As a result, the spread between long and short positions increased by 666.
Indicator signals:
Moving averages
Trading is carried out above the 30 and 50-day moving averages, indicating further correction of the pair.
Note: The period and prices of moving averages are considered by the author on the hourly chart H1 and differ from the general definition of classic daily moving averages on the daily chart D1.
Bollinger Bands
In case of a decline, the lower boundary of the indicator around 1.0755 will act as support.
Indicator Descriptions:
- Moving Average (MA, determines the current trend by smoothing volatility and noise). Period 50. Marked on the chart in yellow.
- Moving Average (MA, determines the current trend by smoothing volatility and noise). Period 30. Marked on the chart in green.
- Moving Average Convergence/Divergence (MACD) indicator. Fast EMA period 12. Slow EMA period 26. SMA period 9.
- Bollinger Bands. Period 20.
- Non-commercial traders - speculators, such as individual traders, hedge funds, and large institutions, use the futures market for speculative purposes and meet certain requirements.
- Non-commercial long positions represent the total long open positions of non-commercial traders.
- Non-commercial short positions represent the total short open positions of non-commercial traders.
- The total non-commercial net position is the difference between non-commercial short and long positions.


