


EUR/USD
Higher Timeframes
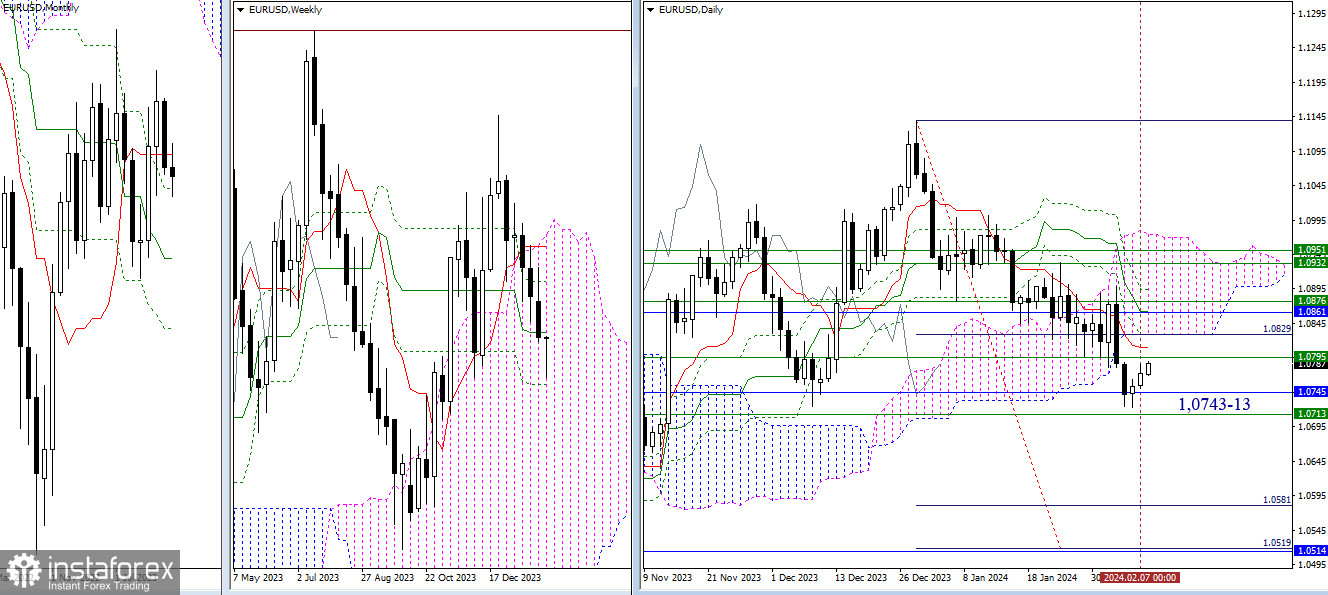
Deceleration around the monthly support level (1.0745) has evolved into a daily corrective rise. The nearest resistances in this chart segment are 1.0795 (weekly medium-term trend) and 1.0811–1.0829 (daily levels). Further, with the continuation of bullish sentiments, the crucial area will be 1.0861–76, where the monthly short-term trend, weekly Fibonacci Kijun, and daily medium-term trend converge efforts. In the event of completing the current corrective movement and a reliable breakdown of monthly (1.0745) and weekly (1.0713) timeframes' supports, a prospect for achieving the daily bearish target (1.0519-81) will open up, strengthened by the monthly medium-term trend (1.0515).
H4 – H1
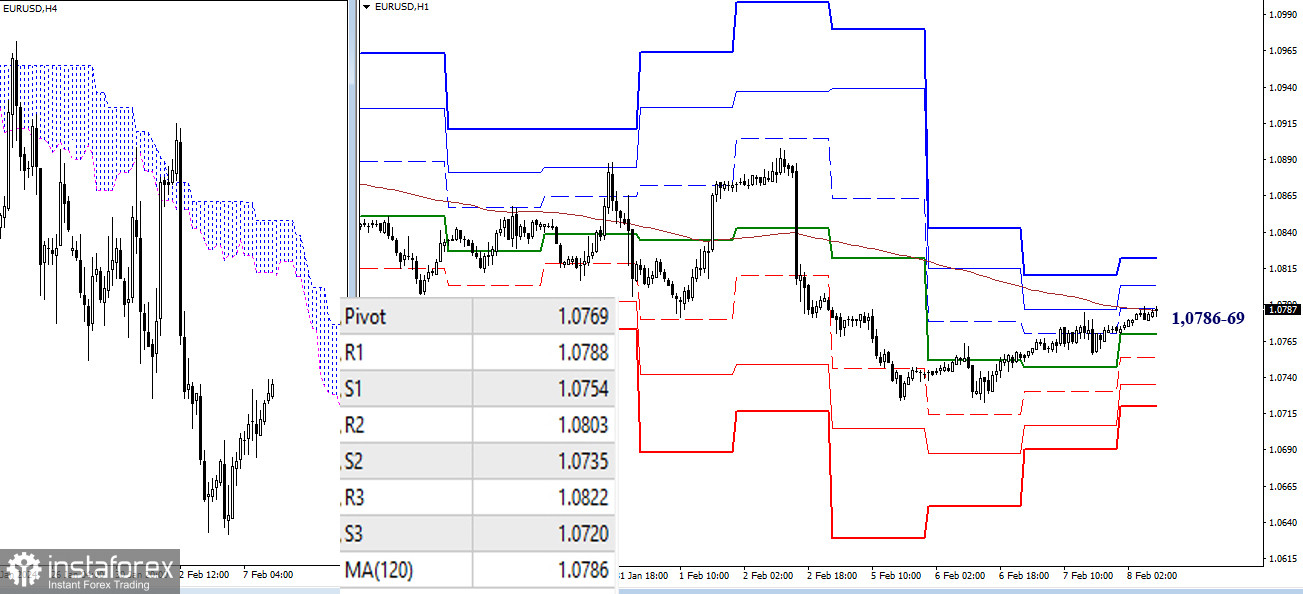
On lower timeframes, the corrective rise reached the weekly long-term trend (1.0786), and the pair began testing it. This trend is a key level for lower timeframes and determines the current balance of power. A breakout and reversal of the movement will allow considering new targets – R2 (1.0803) and R3 (1.0822). In case of completing the correction and rebounding from the trend (1.0786), the pair will initiate a decline, with supports on this path being 1.0769 – 1.0754 – 1.0735 – 1.0720 (classic pivot points).
***
GBP/USD
Higher Timeframes
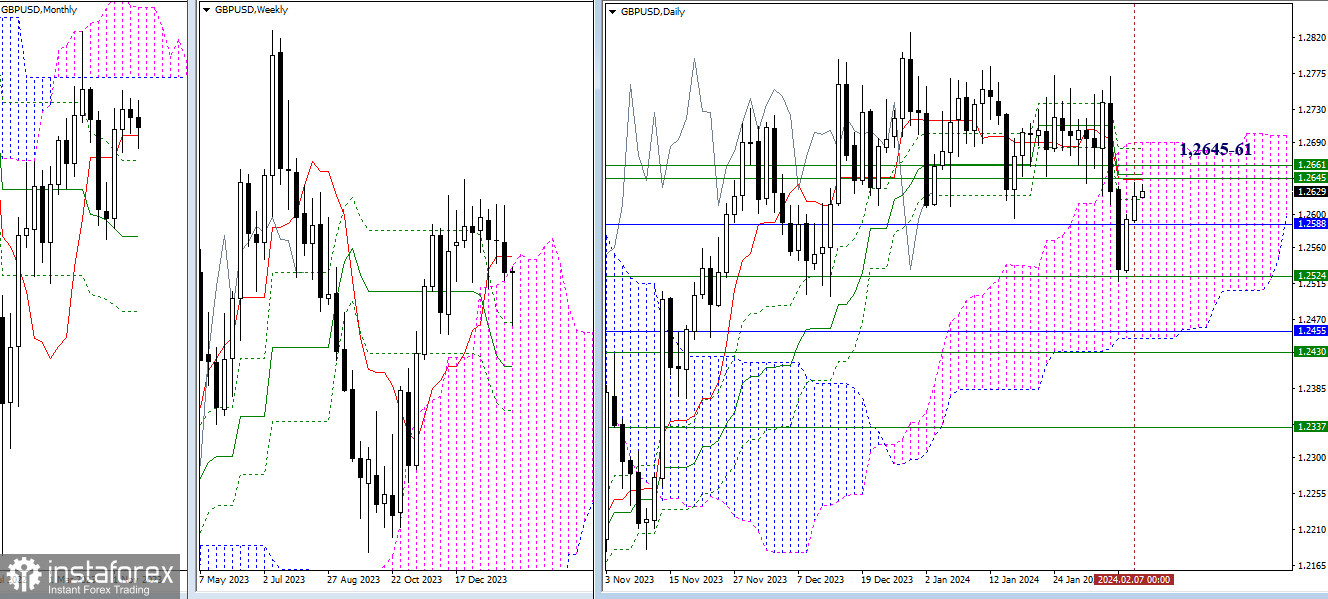
After encountering weekly support (1.2524) on the daily timeframe, an upward correction to the short-term trend (1.2644) is executed. This area is reinforced by weekly resistances (1.2645 – 1.2661), so consolidation above it as well as entering the bullish zone relative to the daily cloud (1.2690), can change the main advantage and open up new possibilities. The immediate supports currently remain at 1.2588 (monthly short-term trend) and 1.2524 (weekly Fibonacci Kijun).
H4 – H1
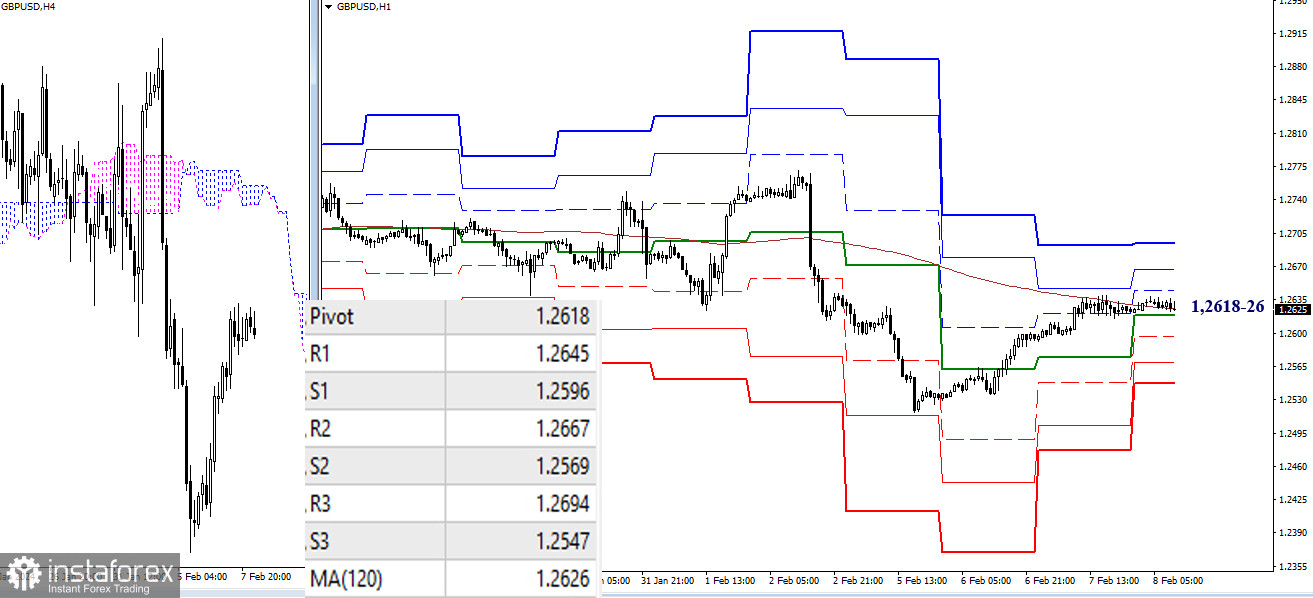
On lower timeframes, there is interaction with the weekly long-term trend (1.2626). Owning this level provides the main advantage. Therefore, operating above the level will contribute to strengthening bullish sentiments, and the intraday targets will be the resistances of classic pivot points (1.2645 – 1.2667 – 1.2694). Trading below these levels will reinforce bearish sentiments, and in the development of the decline, supports of classic pivot points (1.2596 – 1.2569 – 1.2547) may come into play.
***
The technical analysis of the situation uses:
Higher timeframes - Ichimoku Kinko Hyo (9.26.52) + Fibonacci Kijun levels
Lower timeframes - H1 - Pivot Points (classic) + Moving Average 120 (weekly long-term trend)


