


Details of the Economic Calendar on February 9
At the end of last week, the macroeconomic calendar was relatively empty, with no publication of significant statistical data in the European Union, the United Kingdom, and the United States.
Analysis of Trading Charts from February 9
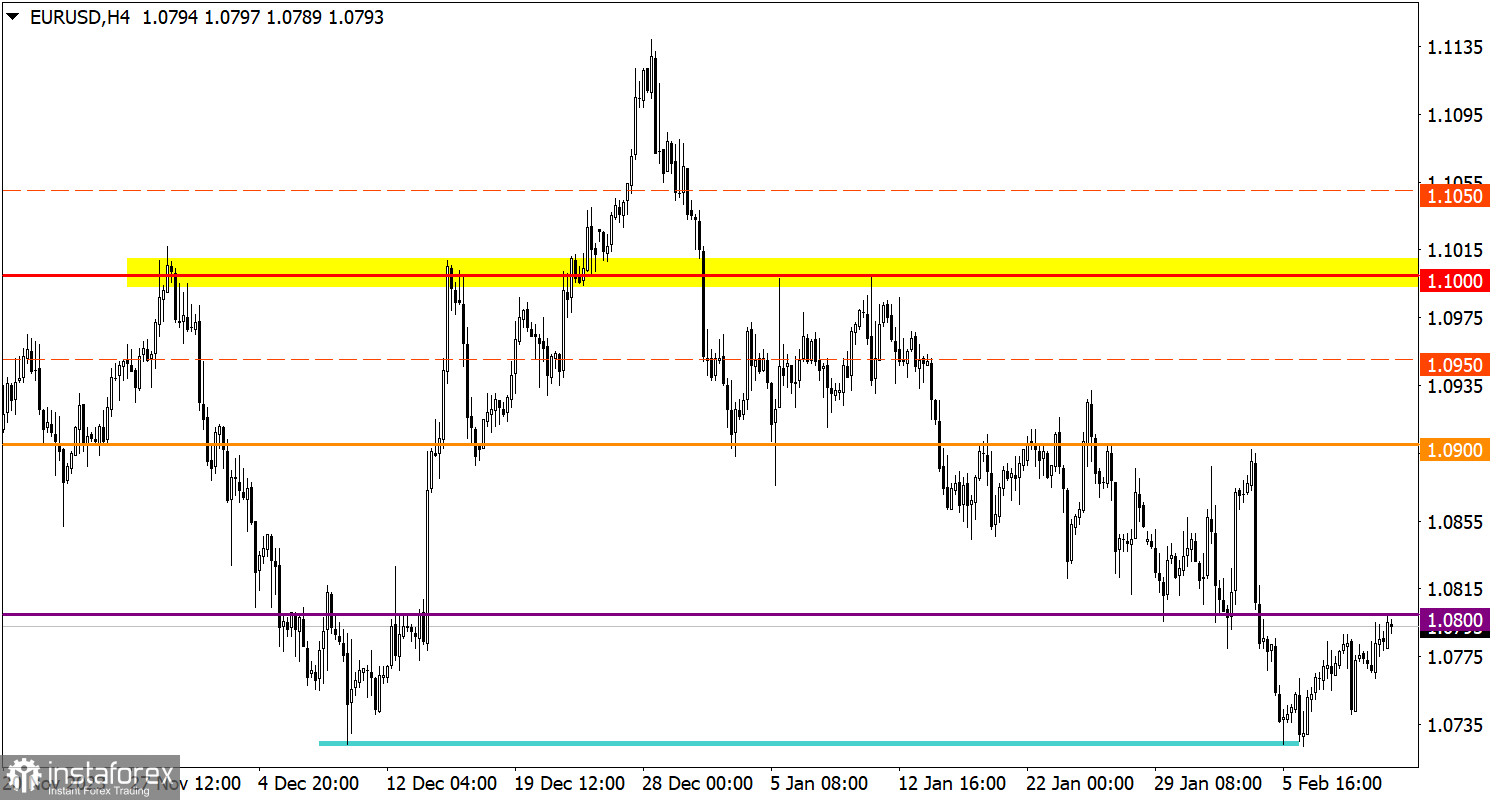
During the pullback, the EUR/USD currency pair returned to the previously passed level of 1.0800. The area of the local low in December serves as a support for sellers, where there has recently been an increase in the volume of long positions.
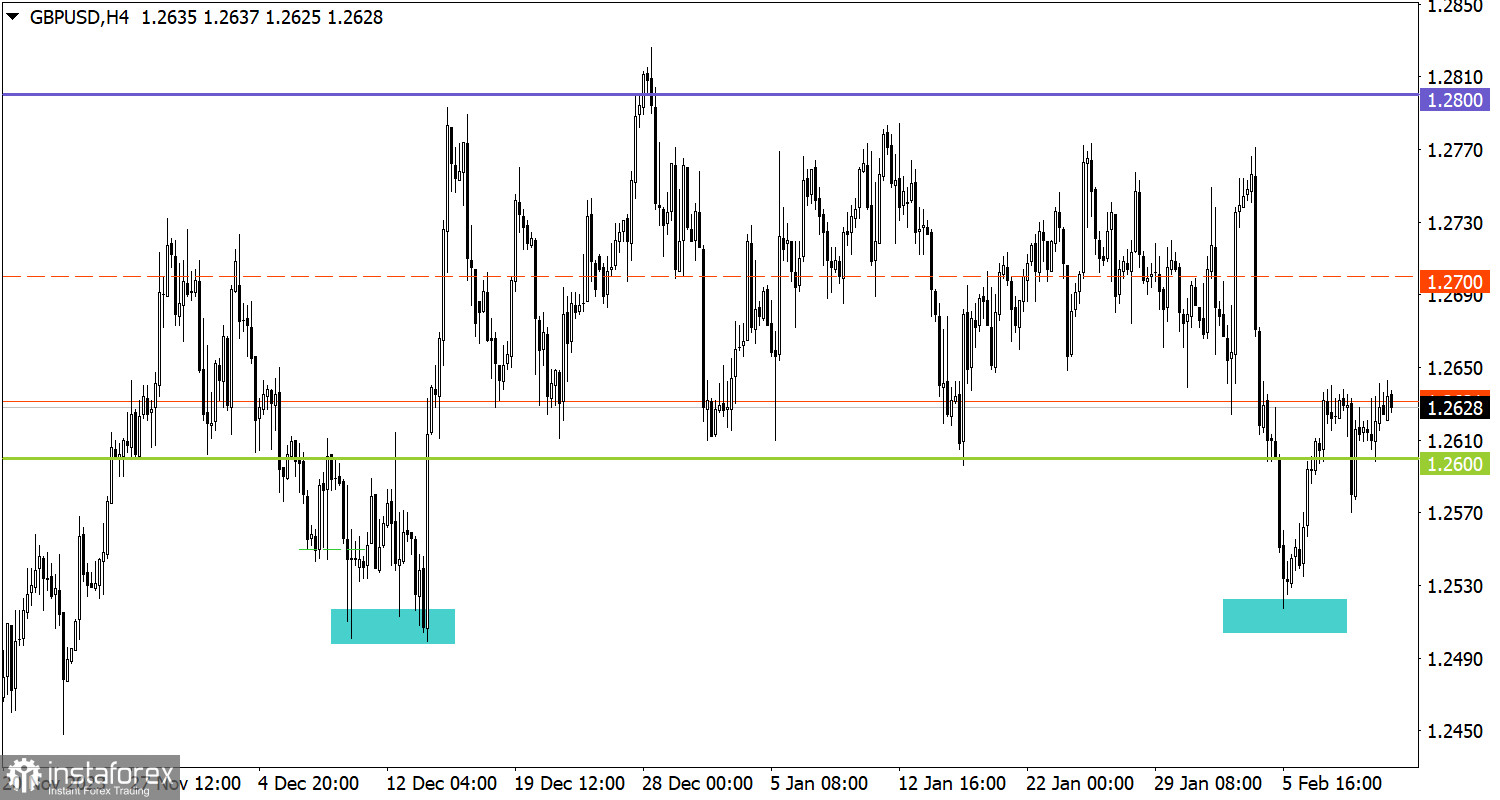
The weekly candle for the GBP/USD pair closed as a doji, indicating uncertainty in the future price movement trajectory. Similar to the situation with the euro, there is increased interest in long positions around the local low in December, and the quote is returning within the previously established sideways channel of 1.2600/1.2800.

Economic Calendar on February 12
Today, the macroeconomic calendar is practically empty, and only a small amount of important statistical data from Europe, the UK, and the United States is expected. However, several representatives of the European Central Bank (ECB) and the Federal Reserve are expected to give a speech, which, theoretically, could lead to increased volatility in financial markets depending on the content of their statements regarding interest rates and the economic situation.
EUR/USD Trading Plan for February 12
For further increase in the volume of long positions, the price must hold above 1.0800 during the current day. In that case, a subsequent stage of the euro's course recovery is possible. However, in a downward scenario, the level of 1.0800 may become resistance for buyers, and we may observe a new attempt to update the local low established in December.
GBP/USD Trading Plan for February 12
Maintaining the quote above the level of 1.2600 indicates that short positions are under pressure from buyers. In connection with this, the scenario of resuming the range of 1.2600/1.2800 remains relevant. Regarding the downward scenario, simply holding the level below 1.2600 is not sufficient; to confirm it, the quote needs to update the December low, reaching a value of around 1.2500.
What's on the charts
The candlestick chart type is white and black graphic rectangles with lines above and below. With a detailed analysis of each individual candle, you can see its characteristics relative to a particular time frame: opening price, closing price, intraday high and low.
Horizontal levels are price coordinates, relative to which a price may stop or reverse its trajectory. In the market, these levels are called support and resistance.
Circles and rectangles are highlighted examples where the price reversed in history. This color highlighting indicates horizontal lines that may put pressure on the asset's price in the future.
The up/down arrows are landmarks of the possible price direction in the future.


