


Analysis of EUR/USD 5M
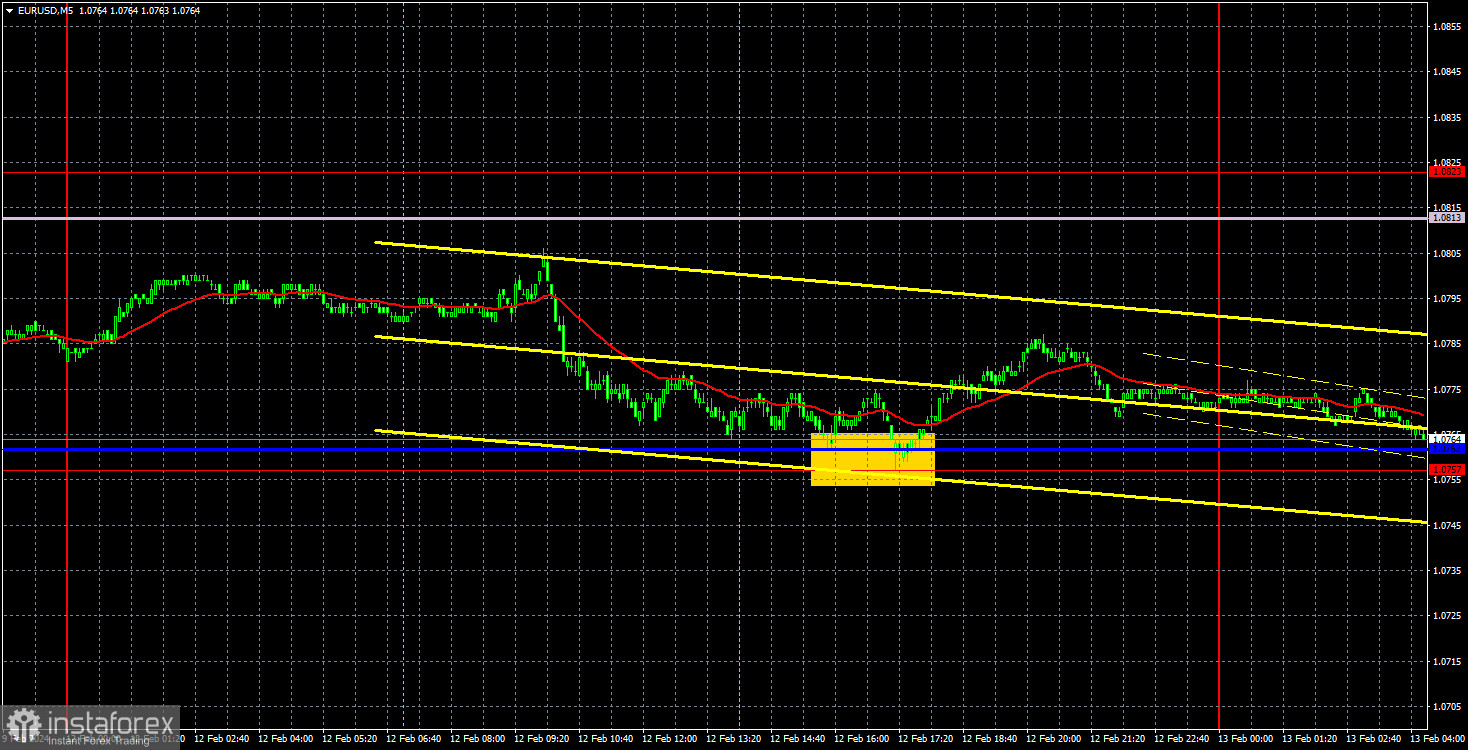
EUR/USD continued to correct higher with low volatility. In fact, not only is volatility low, it is extremely low. In general, the currency pair is showing no movement right now. And if there are no movements, it is impossible to expect good trading signals and high profits. Therefore, we need to endure, and in the future, signals and movements will be better.
This week, there will be significant events in the European Union and the United States that have the potential to move the pair from a dead point. Today, the US inflation report for January will be published, which is resonant in itself. Therefore, we can expect good movement during the US session. In addition to this, we want to remind you that the market continues to transition from the state of "waiting for a rate cut by the Federal Reserve in March" to the state of "waiting for a rate cut no earlier than May-June." This change in market sentiment towards a more hawkish stance may provide support for the US dollar.
At the moment, sellers need to overcome the critical line and finish another flat phase as quickly as possible. We can't consider the current movement as a sideways movement, but daily volatility equal to 40 pips is one of the signs of a flat. If the pair consolidates below the 1.0757-1.0762 area, we can expect a downward movement to follow. The bulls did not even try to consolidate above the Senkou Span B line.
Only one trading signal was generated on Monday, and it is a big question whether traders should have worked on it. During the US session, the price bounced off the critical line and the level of 1.0757, after which it managed to move up by 18 pips. The problem isn't the signals themselves, which do not lead to a high level of profit, but that movements have been so weak that sometimes it doesn't make sense to enter the market.
COT report:
The latest COT report is dated February 6. The net position of non-commercial traders has been bullish for quite some time. The number of long positions is much higher than the number of short positions. However, in recent weeks, the number of longs has been decreasing, while the number of shorts is rising, which aligns with the euro's current movement and our expectations.
We believe that the euro should fall and the uptrend must end. During the last reporting week, the number of long positions for the non-commercial group increased by 2,000, while the number of short positions increased by 28,800. Accordingly, the net position fell by 16,600. The number of buy contracts is still higher than the number of sell contracts among non-commercial traders by 62,000. The gap is quite large, but we're starting to see a noticeable change. Even without COT reports, it is clear that the euro should fall further.
Analysis of EUR/USD 1H
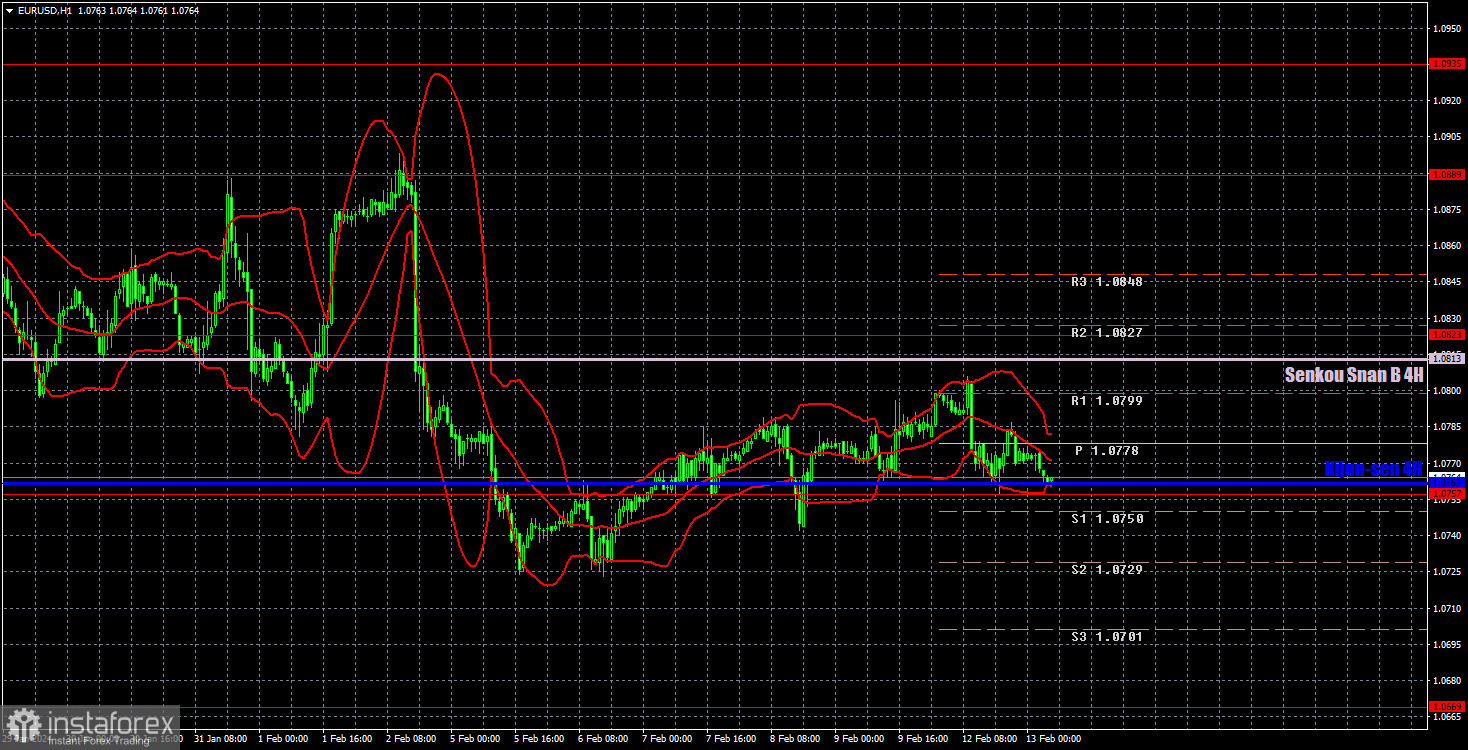
On the 1-hour chart, the downtrend persists. In our opinion, nearly all the factors currently indicate that the dollar will strengthen. In the first days of the new week, we expect the price to either consolidate below the critical line or bounce back from the Senkou Span B line. However, be cautious since the pair's movements are still weak. The US inflation report should fuel market activity, but if the market is not willing to engage in active trading at the moment, no data or important fundamental events will help.
On February 13, we highlight the following levels for trading: 1.0581, 1.0658-1.0669, 1.0757, 1.0823, 1.0889, 1.0935, 1.1006, 1.1092, 1.1137, 1.1185, as well as the Senkou Span B line (1.0813) and the Kijun-sen (1.0762). The Ichimoku indicator lines can move during the day, so this should be taken into account when identifying trading signals. Don't forget to set a breakeven Stop Loss if the price has moved in the intended direction by 15 pips. This will protect you against potential losses if the signal turns out to be false.
On Tuesday, several European Central Bank officials will speak, and the ZEW Economic Sentiment Index will be published. The US inflation report for January will be a key focus. Market players expect a dip in CPI from 3.4% to 2.9% YoY. Such a slowdown may weigh on the dollar, as this could support hopes that the Federal Reserve may trim rates sooner.
Description of the chart:
Support and resistance levels are thick red lines near which the trend may end. They do not provide trading signals;
The Kijun-sen and Senkou Span B lines are the lines of the Ichimoku indicator, plotted to the 1H timeframe from the 4H one. They provide trading signals;
Extreme levels are thin red lines from which the price bounced earlier. They provide trading signals;
Yellow lines are trend lines, trend channels, and any other technical patterns;
Indicator 1 on the COT charts is the net position size for each category of traders;
Indicator 2 on the COT charts is the net position size for the Non-commercial group.


