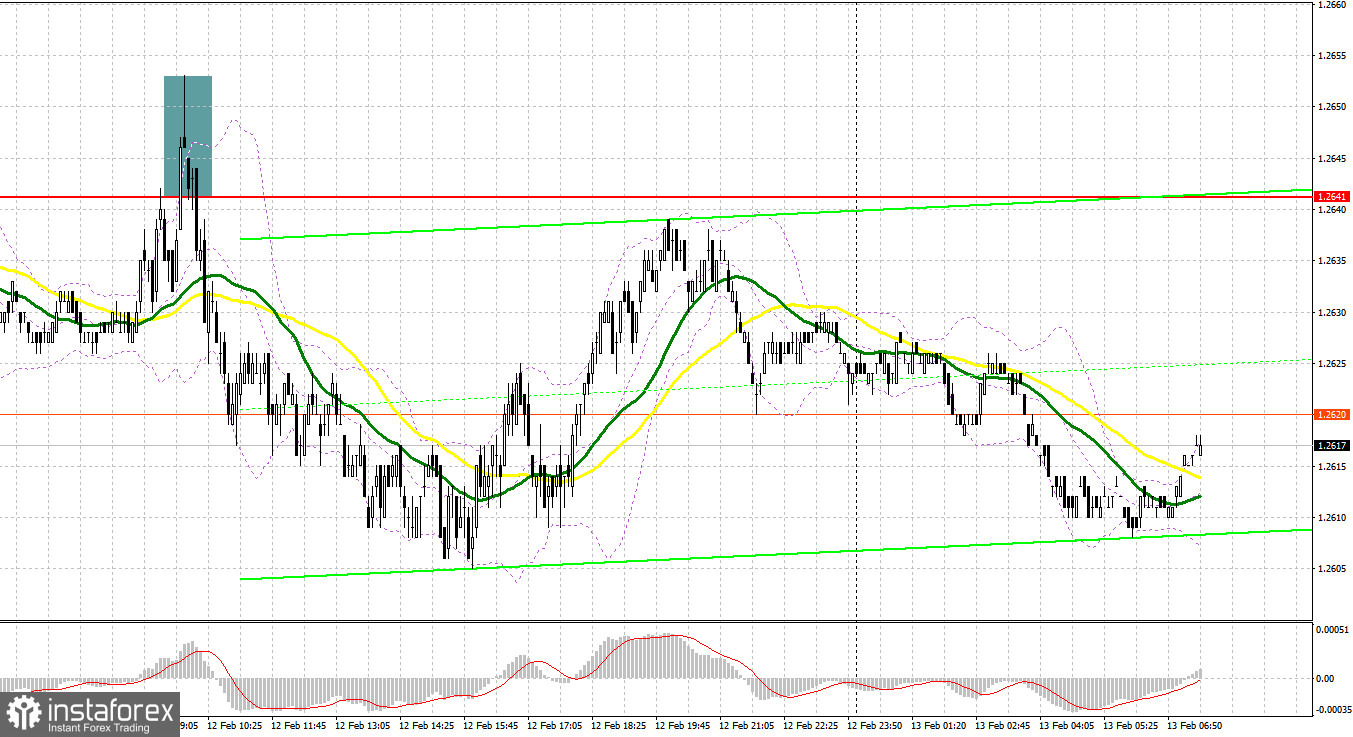
Yesterday, there was only one signal for market entry. Now let's look at the 5-minute chart and try to figure out what actually happened. In my morning forecast, I indicated the level of 1.2641 and planned to make decisions on entering the market from there. A rise and a false breakout at this mark generated a sell signal, which sent the pair down by more than 25 pips, but we didn't reach the target level of 1.2599. In the afternoon, we did not get any good entry points.

COT report:
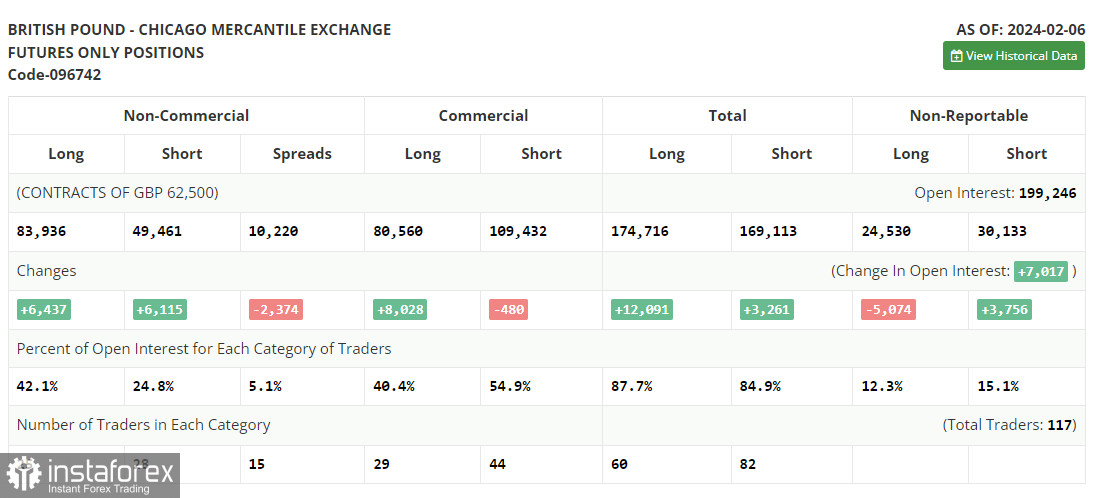
Before discussing the technical aspects of the pound, let's review the recent developments in the futures market. In the COT report (Commitment of Traders) for February 6, we find an increase in both long and short positions. Although traders already have a clear view of the Bank of England's future policy, which intends to continue actively controlling inflation, the pound is not in a rush to show growth. Recent statements by BoE officials indicate a soft wait-and-see stance that can change at any moment – if, of course, the data allows. In the near future, we can look forward to UK reports on the labor market, wage growth, and inflation, which can significantly change the balance of power in the market. But don't forget to add the Federal Reserve's wait-and-see position to all of this, so uncertainties are much greater now than before. The latest COT report said that long non-commercial positions rose by 6,437 to 83,936, while short non-commercial positions increased by 6,115 to 49,461. As a result, the spread between long and short positions decreased by 2,374.

For long positions on GBP/USD:
Today, the UK will release reports on the number of claims for unemployment benefits, and the unemployment rate, but the focus will be on the report on average earnings. If the figures significantly fall, this will weigh on the British pound, and the pair will fall in the first half of the day.
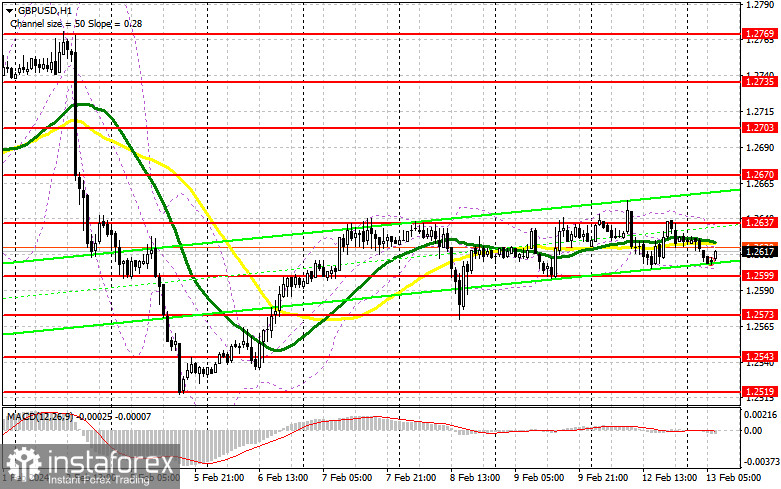
The most preferable scenario for me in the current situation would be to buy during a decline after a false breakout forms near 1.2599. This will provide an entry point with an upward target at the resistance level of 1.2637, which was established yesterday. Slightly below this level, we have the moving averages that favor the sellers. A break and downward test of this range will cement the chance of a further recovery in GBP/USD. In turn, this will allow traders to increase long positions. Eventually, the price could reach 1.2670. In case the price tops this level, we can talk about a breakout to 1.2703, where I am going to take profit. In a scenario where GBP/USD falls and there are no buyers at 1.2599, the sellers will have a chance to push the pound to the area of 1.2573. Traders will buy there only on a false breakout. You can open long positions on GBP/USD immediately on a rebound from 1.2543, bearing in mind an intraday correction of 30-35 pips.
For short positions on GBP/USD:
The bears have a good chance to regain the initiative. This requires weak UK labor market data and strong US inflation, which we will talk about in the afternoon. If the GBP/USD grows, sellers will have to defend the nearest resistance at 1.2637, which has proven itself recently. A false breakout at this level will create a sell signal with the expectation of the pair's decline and the test of the 1.2599 support. A breakout and an upward retest of this range will increase pressure on the pair, giving bears an advantage and a sell entry point with the target at 1.2573, where I anticipate more active buyers. The next target would be low of 1.2543, where I plan to take profits. If GBP/USD grows and there are no bears at 1.2637, the bulls will regain the advantage, and this could push the pair to rise to the next resistance at 1.2670. I would also advise selling there only on a false breakout. If there is no movement there, I will sell GBP/USD on a bounce right from 1.2703, considering a downward correction of 30-35 pips within the day.

Indicator signals:
Moving Averages
Trading below the 30- and 50-day moving averages indicates a possible decline in the pair.
Please note that the time period and levels of the moving averages are analyzed only for the H1 chart, which differs from the general definition of the classic daily moving averages on the D1 chart.
Bollinger Bands
If GBP/USD grows, the indicator's upper boundary near 1.2637 will serve as resistance. If it falls, the indicator's lower boundary near 1.2599 will serve as support.
Description of indicators:
• A moving average of a 50-day period determines the current trend by smoothing volatility and noise; marked in yellow on the chart;
• A moving average of a 30-day period determines the current trend by smoothing volatility and noise; marked in green on the chart;
• MACD Indicator (Moving Average Convergence/Divergence) Fast EMA with a 12-day period; Slow EMA with a 26-day period. SMA with a 9-day period;
• Bollinger Bands: 20-day period;
• Non-commercial traders are speculators such as individual traders, hedge funds, and large institutions who use the futures market for speculative purposes and meet certain requirements;
• Long non-commercial positions represent the total number of long positions opened by non-commercial traders;
• Short non-commercial positions represent the total number of short positions opened by non-commercial traders;
• The non-commercial net position is the difference between short and long positions of non-commercial traders.


