


EUR/USD
Higher Timeframes
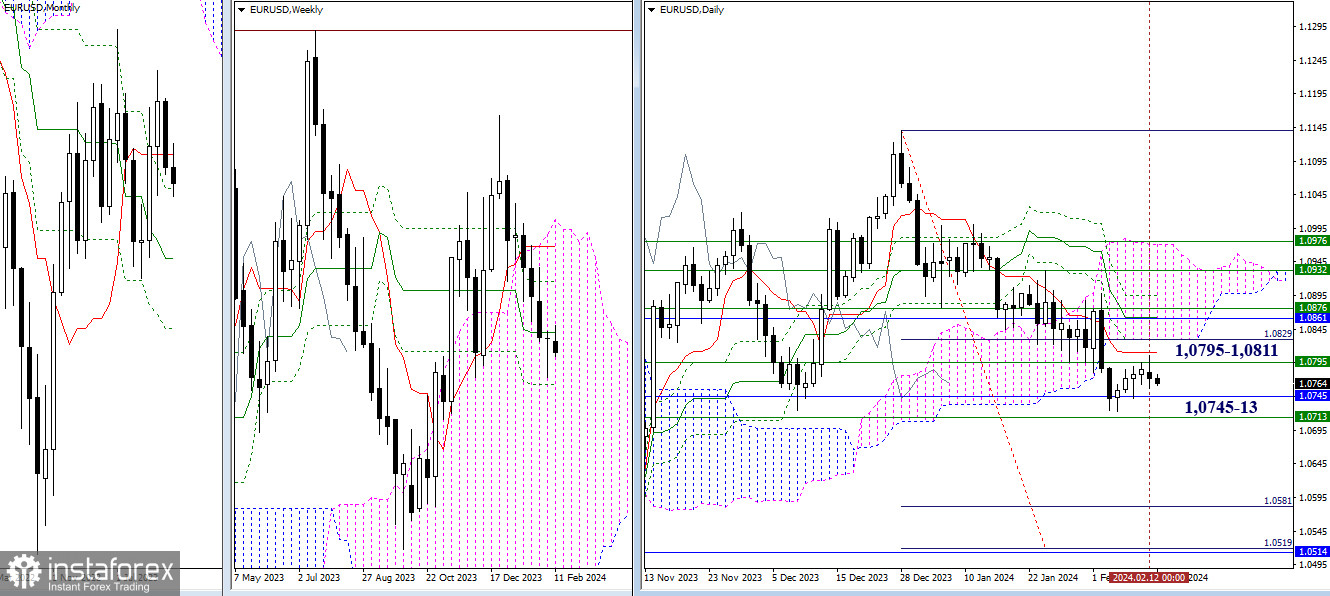
There is no progress in the situation. The pair remains in the correction zone, below resistances around 1.0795 (weekly medium-term trend) - 1.0811 (daily short-term trend). The breakdown of support levels of the monthly (1.0745) and weekly (1.0713) timeframes could open new perspectives for the bears and maintain their positions today. A secure breakout beyond the designated targets could lead to a change in the current situation.
H4 – H1
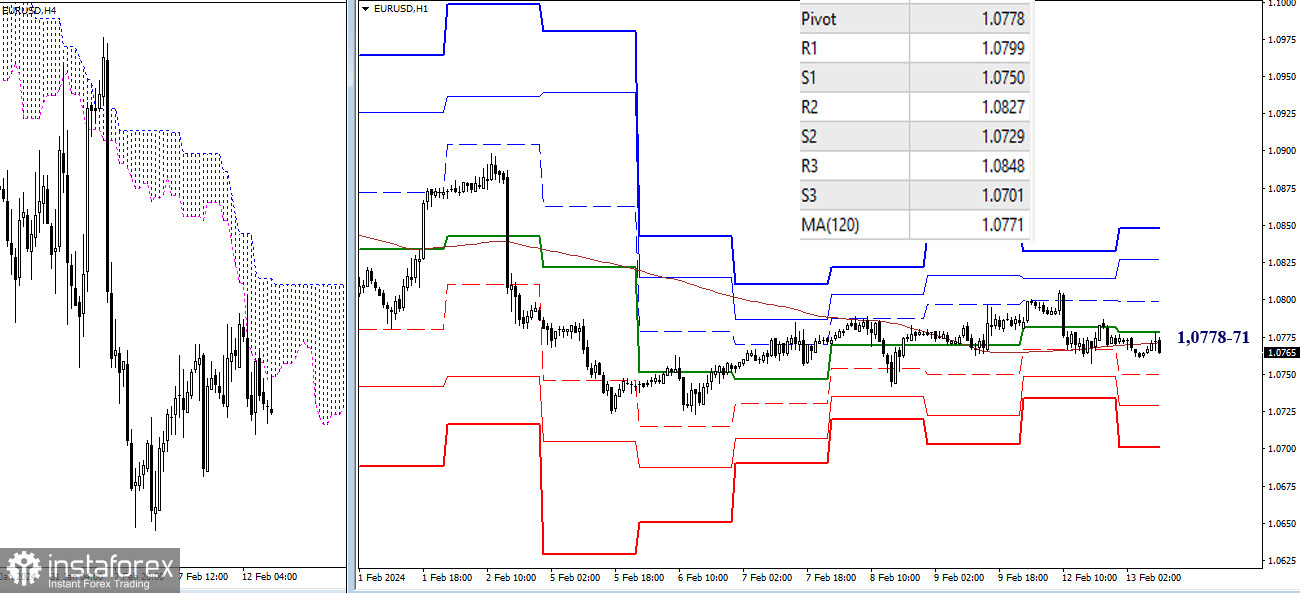
On the lower timeframes, the attraction and influence of key levels, today at 1.0778-71 (central pivot point of the day + weekly long-term trend), continue to restrain the development of the directional movement. In case of a change in priorities and activity from one side, the market's attention during the day will be directed towards the classic pivot points. For the bears, breaking through supports (1.0750 – 1.0729 – 1.0701) will be interesting, while the bulls will focus on resistances (1.0799 – 1.0729 – 1.0701).
***
GBP/USD
Higher Timeframes
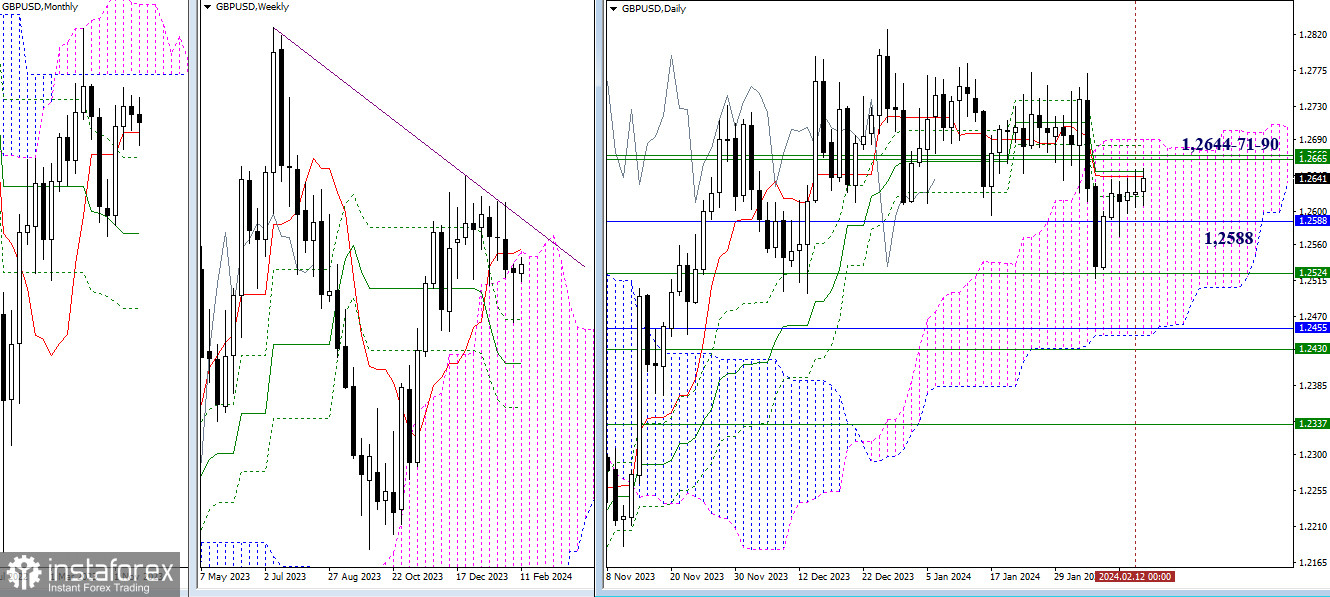
Consolidation under resistances is maintained, where several strong and significant levels (1.2644-51 – 1.2669-71 – 1.2682-90) from different timeframes have converged. Breaking through this zone and establishing a firm position will allow the bulls to make new plans. If the bears intend to exit the consolidation zone, they must first overcome the supports at 1.2588 (monthly short-term trend) – 1.2524 (weekly Fibonacci Kijun).
H4 – H1
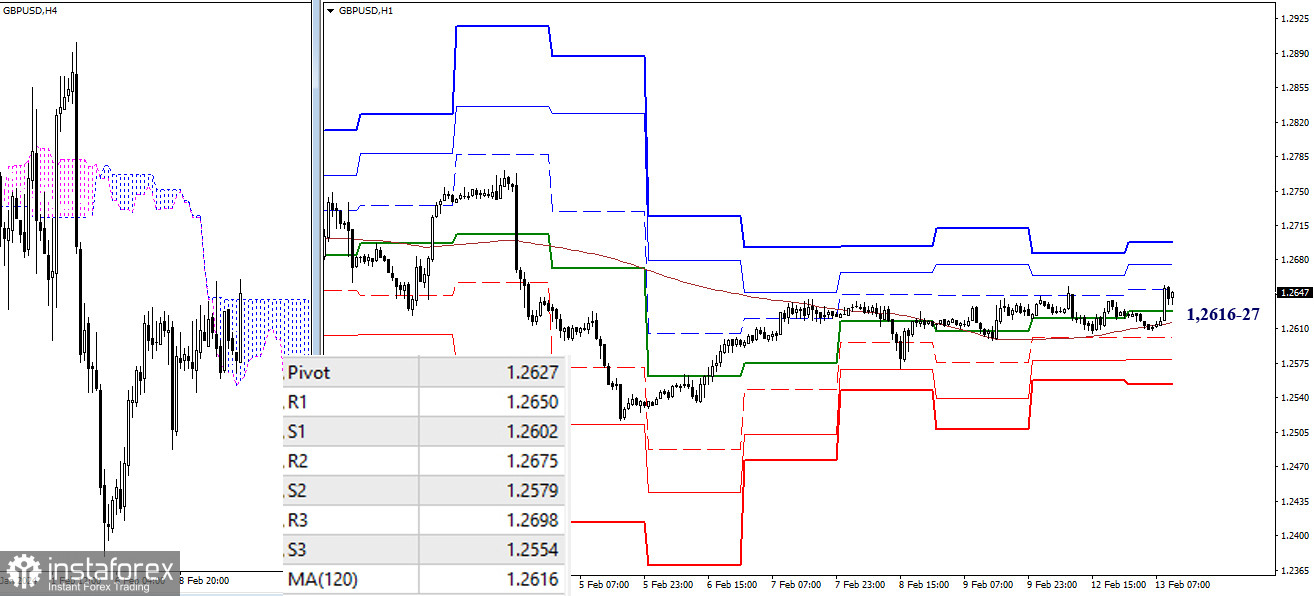
The weekly long-term trend (1.2616) continues to restrain the onset of changes and maintains the advantage for the bulls. The first resistance of the classic pivot points (1.2650) is currently being tested, and further attention will be directed to 1.2675 (R2) – 1.2698 (R3). A shift in sentiment, in the form of breaking the weekly long-term trend, will return the market to the bearish zone, and an increase in bearish sentiments during the day will be possible after breaking through the supports of the classic pivot points, which are currently located at 1.2602 – 1.2579 – 1.2554.
***
The technical analysis of the situation uses:
Higher timeframes - Ichimoku Kinko Hyo (9.26.52) + Fibonacci Kijun levels
Lower timeframes - H1 - Pivot Points (classic) + Moving Average 120 (weekly long-term trend)


