


In my morning forecast, I focused on the level of 149.65 and planned to make trading decisions based on it. Let's look at the 5-minute chart and analyze what happened there. The growth and the formation of a false breakout there resulted in an excellent selling point for the dollar, which, at the time of writing this article, led to a 20-point drop in the pair. For the second half of the day, the technical picture has not been revised.
To open long positions on USD/JPY, the following is required:
Obviously, after weak statistics on Japan and with fewer willing to sell the yen ahead of important US inflation data, the direction of the pair depends on how prices swing. Rising prices in the US mean an increase in USD/JPY with a resumption of the bullish market. Falling prices mean a decline in the dollar and a good chance for a correction, allowing entry into purchases at more attractive prices.
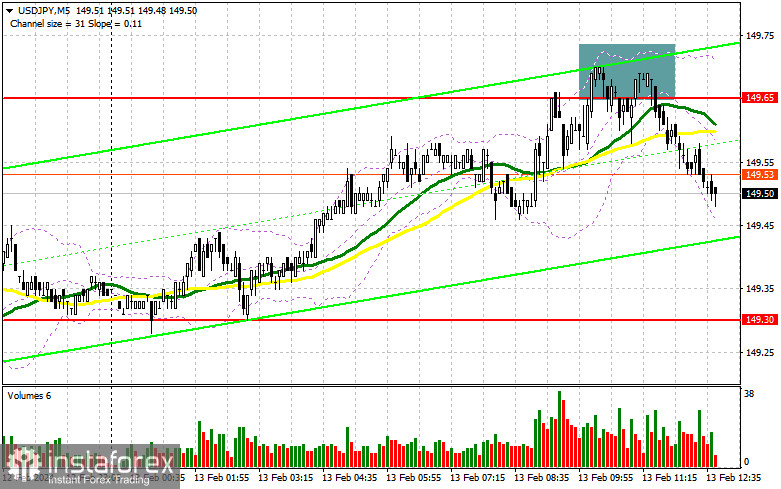
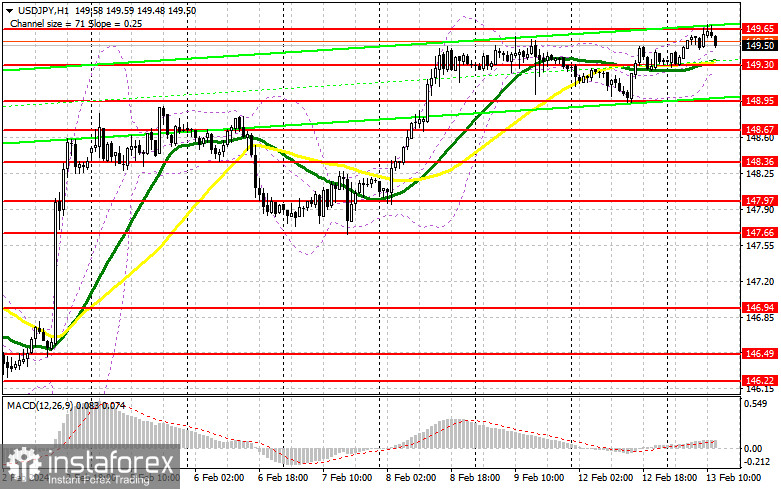
Further actions will be taken in the development of the bullish market, and the decline in USD/JPY will be a reason to enter at acceptable prices. The formation of a false breakout around the new support of 149.30 will provide an entry point for buying with the goal of growth to the resistance area of 149.65, above which the pair has not managed to rise today. Breaking and consolidating above this range will allow buyers to strengthen their positions in the market, giving them a chance to open long positions with an exit at 149.98. The ultimate target will be a maximum of 150.38, where I will take profit. In the scenario of the pair's decline and the lack of activity at 149.30 from buyers in the second half of the day after weak US inflation data, and where the moving averages are located, playing in their favor, pressure on the pair will increase. In such a case, I will try to enter the market around 148.95. But only a false breakout there will be a suitable condition for opening long positions. I plan to buy USD/JPY only on a rebound from 148.67 with the target of a correction by 30-35 points within the day.
To open short positions on USD/JPY, the following is required:
Sellers coped well with their tasks in the first half of the day, not allowing the pair beyond the annual maximum. In case of another rise in the pair, bears need to concentrate and act around the resistance of 149.65. A false breakout at this level, similar to what I analyzed above, will provide a good entry point for selling with a move to support at 149.30, where the moving averages, playing on the side of buyers, are located. Breaking and reverse testing from the bottom to the top of this range will deal a more serious blow to bullish positions, leading to triggering stop orders and opening the way to 148.95, which will be a significant success for sellers. The ultimate target will be the area around 148.67, where I will take profit. In the case of USD/JPY growth and the absence of bear activity at 149.65 in the second half of the day, the development of a new bullish trend will begin. Therefore, it is better to postpone selling until testing the next resistance at 149.98. In the absence of downward movement there, I will sell USD/JPY immediately on a rebound from 150.38, but only expecting a pair correction down by 30-35 points within the day.
Indicator signals:
Moving averages:
Trading is conducted above the 30 and 50-day moving averages, indicating the dollar's rise.
Note: The period and prices of moving averages are determined by the author on the hourly chart H1 and differ from the general definition of classic daily moving averages on the daily chart D1.
Bollinger Bands:
In case of a decline, the lower boundary of the indicator at 149.30 will act as support.
Description of indicators:
- Moving Average (MA) is a trend indicator, determining the current trend by smoothing volatility and noise. Period 50. Marked on the chart in yellow.
- Moving Average (MA) is a trend indicator, determining the current trend by smoothing volatility and noise. Period 30. Marked on the chart in green.
- MACD indicator (Moving Average Convergence/Divergence) Fast EMA period 12. Slow EMA period 26. SMA period 9.
- Bollinger Bands - volatility indicator consisting of an SMA and two standard deviations from it. Period 20.
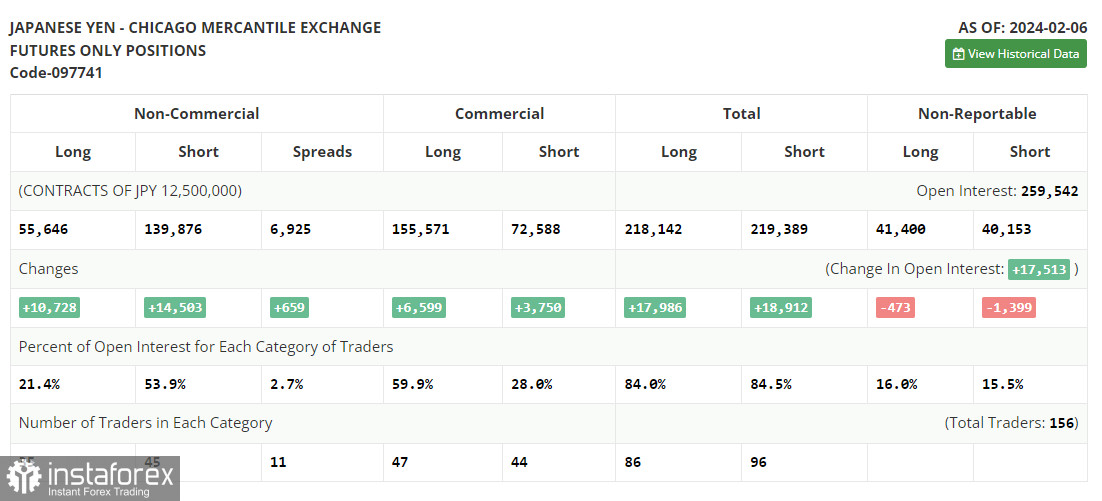
- Non-commercial traders - speculators, such as individual traders, hedge funds, and large institutions, using the futures market for speculative purposes and meeting certain requirements.
- Long non-commercial positions represent the total long open position of non-commercial traders.
- Short non-commercial positions represent the total short open position of non-commercial traders.
- The total non-commercial net position is the difference between non-commercial long and short positions.


