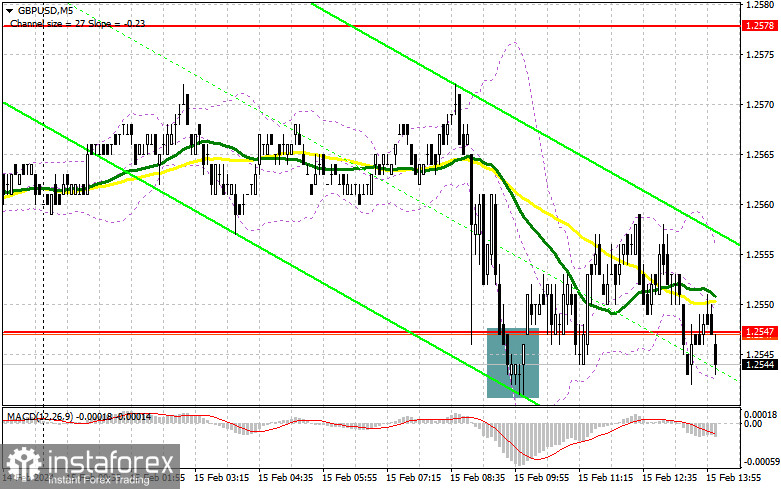
In my morning forecast, I paid attention to the 1.2547 level and planned to make decisions on entering the market from it. Let's look at the 5-minute chart and figure out what happened. The decline and the formation of a false breakdown after weak UK GDP data was an adventure to open long positions. As a result, it was possible to observe an increase of 10 points, after which trade returned to the area of 1.2547. In the afternoon, the technical picture was revised.

To open long positions on GBP/USD, it is required:
The released data on UK GDP turned out to be lower than economists' forecasts, which weakened demand for the pound and led to its next sell-off, observed throughout this week. Sellers are aiming to update the annual minimum, so I'm unlikely to make any purchase decisions before its test. Important data on retail sales in the United States are ahead. A sharp reduction in sales will be good for inflation, but bad for the economy. The drop in sales is the fall of the dollar and the rise of the pound. If the opposite happens, it will be possible to observe the update of the next annual lows for the pair.
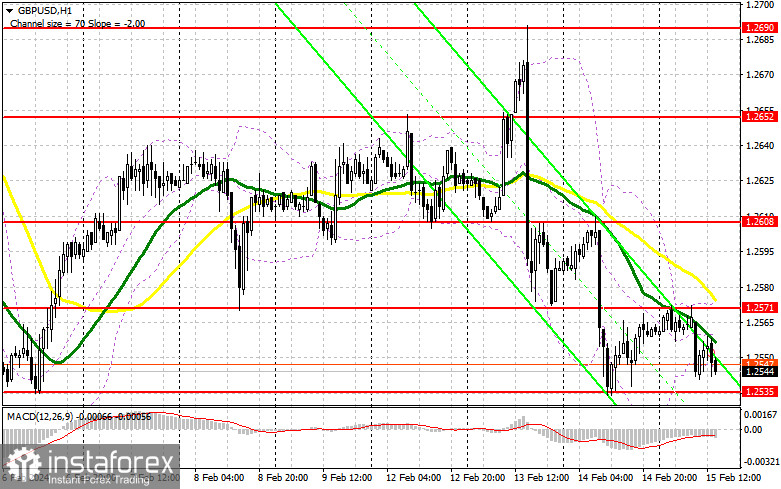
I plan to act against the new trend only after the decline and the formation of a false breakdown in the area of 1.2535. This will give an excellent entry point into long positions in the expectation of correction and recovery of the pair to 1.2571 – a new resistance formed at the end of the first half of the day. A breakthrough and consolidation above this range against the background of weak US statistics will strengthen demand for the pound, opening the way to 1.2608. The farthest goal will be a maximum of 1.2652, where I'm going to fix the profit. In the scenario of a decline in the pair and a lack of activity on the part of the bulls at 1.2535 in the afternoon, the pressure on the pound will remain. In this case, I will postpone purchases until the 1.2507 test. Only a false breakout will confirm the correct entry point into the market. I plan to buy GBP/USD immediately for a rebound from the minimum of 1.2482 to correct by 30-35 points within the day.
To open short positions on GBP/USD, you need:
Sellers control the market and are aiming for an annual minimum. I prefer to open new short positions only on growth in the resistance area of 1.2571, where the moving averages are playing on the sellers' side. Only the formation of a false breakdown will make it possible to verify the presence of major players, which will lead to a decrease in the area of 1.2535. A breakout and a reverse test from the bottom up of this range will hit the bull positions, leading to the demolition of stop orders and opening the way to 1.2507, which will only strengthen the bearish trend. The farthest target will be the 1.2482 area, where profits will be fixed. With the option of GBP/USD growth and lack of activity at 1.2571 in the afternoon, buyers will try to build a small upward correction. In this case, I will postpone sales until a false breakdown at the level of 1.2608. In the absence of a downward movement there, I will sell GBP/USD immediately for a rebound from 1.2652, but only counting on a correction of the pair down by 30-35 points within the day.


Indicator signals:
Moving averages
Trading is below the 30 and 50-day moving averages, which indicates a further decline in the pair.
Note: The period and prices of the moving averages are considered by the author on the hourly chart H1 and differ from the general definition of the classic daily moving averages on the daily chart D1.
Bollinger Bands
In case of a decline, the lower limit of the indicator around 1.2545 will act as support.
Description of the indicators
• Moving average (moving average, determines the current trend by smoothing volatility and noise). Period 50. It is marked in yellow on the chart.
• Moving average (moving average, determines the current trend by smoothing volatility and noise). Period 30. It is marked in green on the chart.
• MACD indicator (Moving Average Convergence/Divergence — convergence/divergence of moving averages) Fast EMA period 12. Slow EMA period 26. SMA period 9
• Bollinger Bands. Period 20
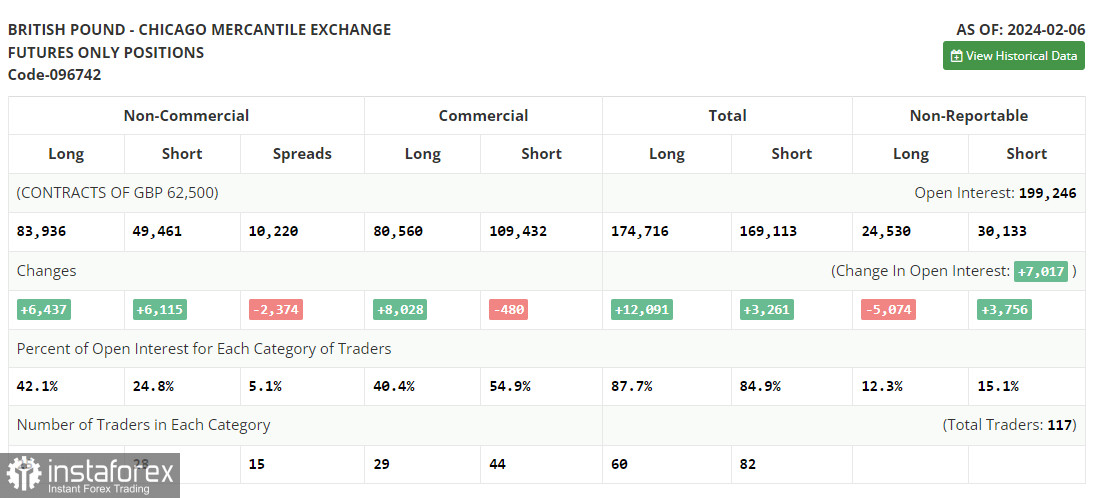
• Non-profit speculative traders, such as individual traders, hedge funds, and large institutions that use the futures market for speculative purposes and meet certain requirements.
• Long non-commercial positions represent the total long open position of non-commercial traders.
• Short non-commercial positions represent the total short open position of non-commercial traders.
• The total non-commercial net position is the difference between the short and long positions of non-commercial traders.


