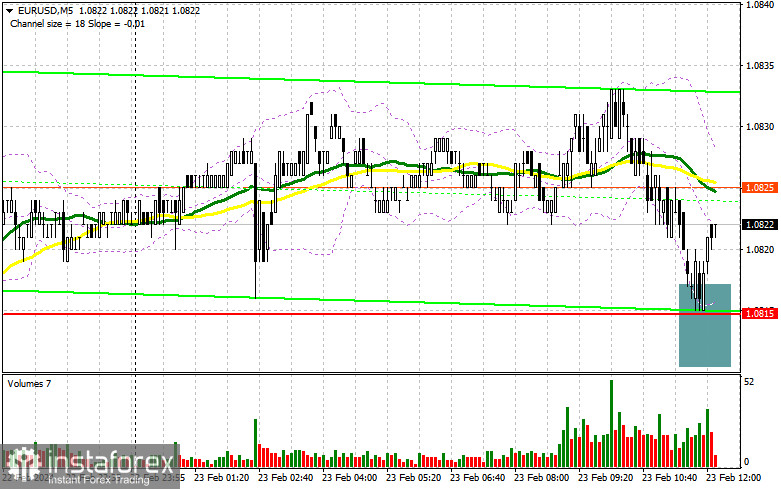
In my morning forecast, I paid attention to the 1.0815 level and planned to make decisions on entering the market from it. Let's look at the 5-minute chart and figure out what happened there. The decline and the formation of a false breakdown at 1.0815 led to a buy signal, but at the time of writing, it had not reached a major increase, although the pair had already rolled back up by 10 points. Until the moment when trading is above 1.0815, you can count on the implementation of the signal. In the afternoon, the technical picture was not revised.

To open long positions on EURUSD, you need:
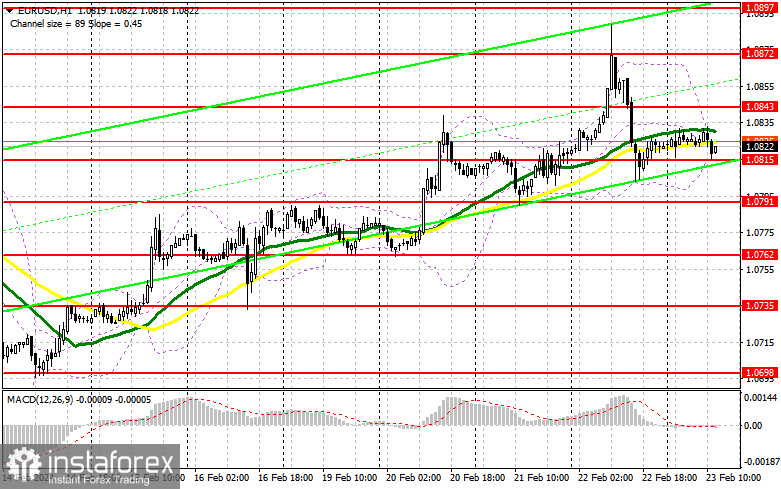
There are no fundamental statistics for the United States ahead, so trade can continue within the channel, and the euro will retain its chances of growth. I will act based on the morning strategy: the formation of a false breakdown in the area of the nearest support at 1.0815, similar to what I discussed above, will be a suitable condition for purchases in the expectation of continued growth of the pair in the area of 1.0843. A breakout and a top-down update of this range will give you a chance to buy with a jerk at 1.0872. The farthest target will be a maximum of 1.0897, where I will record profits. With the option of a decrease in EUR/USD and a lack of activity at 1.0815 in the afternoon, and this level has already worked itself out once, the pressure on the pair will increase, which will lead to a larger decline in the euro with the prospect of locking in a side channel. In such a case, I plan to enter the market only after the formation of a false breakout around 1.0791. I will consider opening long positions immediately on a rebound from 1.0762 with a target of a 30-35 point upward correction within the day.
To open short positions on EUR/USD, the following is required:
The bears tried, but it turned out quite poorly. In the case of the pair's rise in the second half of the day, the formation of a false breakout around 1.0843 will signal a sale, opening the way to 1.0815. Breaking and consolidating below this range, as well as a reverse test from bottom to top, will provide another selling point with a drop in the pair to around 1.0791, restoring balance to the market and locking the pair in a sideways channel. The ultimate target will be a minimum of 1.0762, where I will take profits. In the event of an upward movement of EUR/USD during the American session and the absence of bears at 1.0843, buyers will continue to build an upward trend. In such a case, I will postpone selling until testing the next resistance at 1.0872. I will also sell there, but only after an unsuccessful consolidation. I plan to open short positions immediately on a rebound from 1.0897 with a target of a 30-35 point downward correction.


Indicator Signals:
Moving Averages:
Trading is carried out around the 30 and 50-day moving averages, indicating a sideways market.
Note: The period and prices of moving averages considered by the author are on the hourly chart (H1) and differ from the general definition of classic daily moving averages on the daily chart (D1).
Bollinger Bands:
In case of a decline, the lower boundary of the indicator around 1.0815 will act as support.
Description of Indicators:
Moving Average (determines the current trend by smoothing volatility and noise). Period 50. Marked on the chart in yellow.
Moving Average (determines the current trend by smoothing volatility and noise). Period 30. Marked on the chart in green.
MACD Indicator (Moving Average Convergence/Divergence). Fast EMA period 12. Slow EMA period 26. SMA period 9.
Bollinger Bands. Period 20.
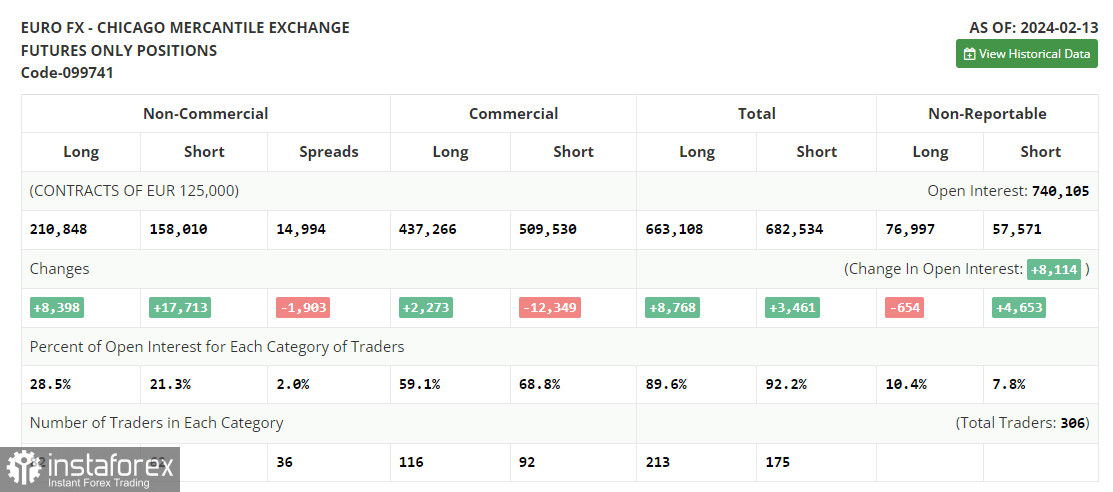
Non-commercial traders - speculators, such as individual traders, hedge funds, and large institutions, use the futures market for speculative purposes and meet certain requirements.
Long non-commercial positions represent the total long open position of non-commercial traders.
Short non-commercial positions represent the total short open positions of non-commercial traders.
The total non-commercial net position is the difference between the short and long positions of non-commercial traders.


