


GBP/USD
Analysis:
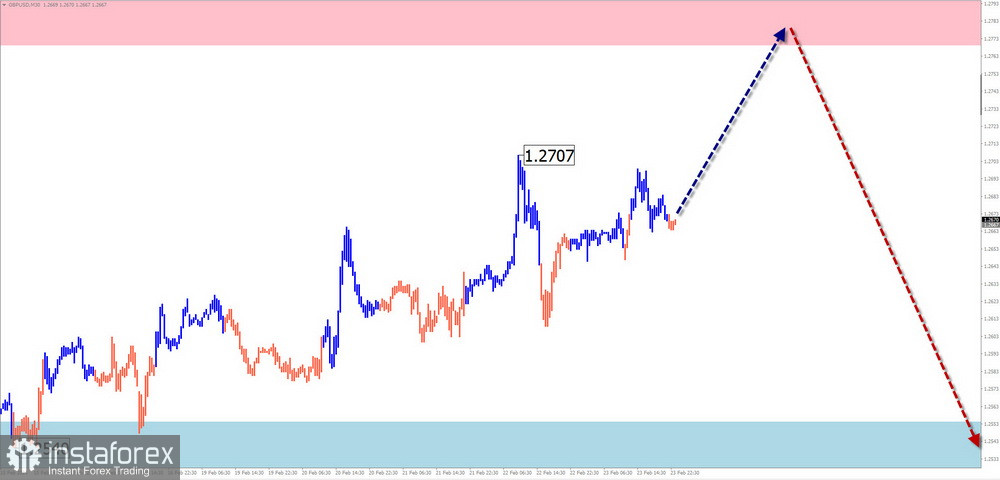
The British pound chart continues to form a descending wave that started in July of the previous year. Since mid-December, the price and strong resistance have formed the beginning of the final part (C). In its structure, an intermediate correction has been developing since early February, which still needs to be completed at the time of the analysis.
Forecast:
At the beginning of the upcoming week, one can expect the continuation of the overall bullish sentiment of the British currency, with a price increase towards the resistance zone. Subsequently, the formation of a reversal in a sideways flat is likely. A change in direction and the start of a decline are expected by the end of the week.
Potential Reversal Zones:
Resistance:
- 1.2770/1.2820
Support:
- 1.2550/1.2500
Recommendations:
Buying: Possible with a fractional volume within intraday until the first reversal signals.
Selling: Relevant only after confirmed reversal signals appear in the support area according to your trading system.
AUD/USD
Analysis:
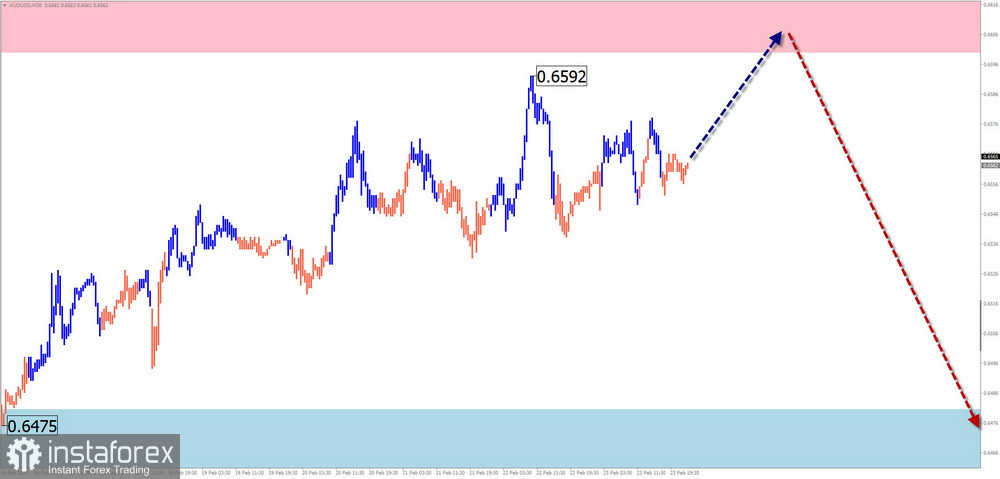
The current wave structure of the Australian dollar chart from December 28th of the previous year is directed "south" of the price chart. For the last one and a half months, quotes have been corrected, and the structure is nearing completion. The price is approaching the lower boundary of a potential reversal zone of a large timeframe.
Forecast:
In the first few days of the upcoming week, there is a high probability of continued upward movement and pressure on the resistance zone. A brief breach of its lower boundary is not excluded. Closer to the weekend, the likelihood of a resumption of price decline and downward movement towards the support area increases.
Potential Reversal Zones:
Resistance:
- 0.6600/0.6650
Support:
- 0.6480/0.6430
Recommendations:
Selling: This can become the main direction for trading after the appearance of confirming signals in the resistance area.
Buying: Possible in separate sessions with a reduced volume.
USD/CHF
Analysis:
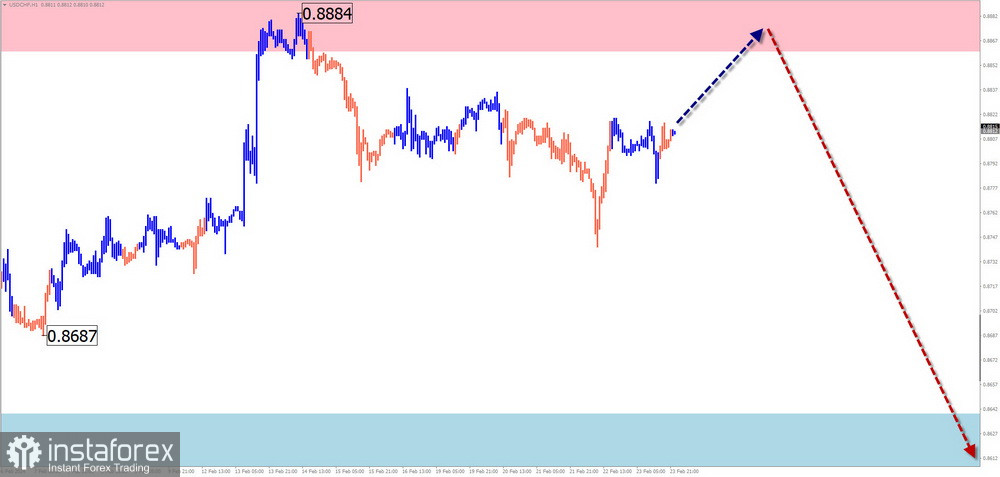
The direction of the price movement of the USD/CHF pair since the end of December of the previous year sets the algorithm of an ascending wave. The price has reached the lower boundary of a powerful reversal zone on the daily timeframe. The bearish segment that started on February 14th has a reversal potential and could be the beginning of a full-fledged pair correction.
Forecast:
In the first half of the week, one can expect the continuation of the upward movement vector. A stop and reversal are expected in the calculated resistance zone. The start of a new decline can be expected closer to the weekend.
Potential Reversal Zones:
Resistance:
- 0.8860/0.8910
Support:
- 0.8640/0.8590
Recommendations:
Buying: This can be used in separate trading sessions with a reduced volume.
Selling: There are conditions for such transactions once confirmed reversal signals appear in the resistance area.
EUR/JPY
Analysis:
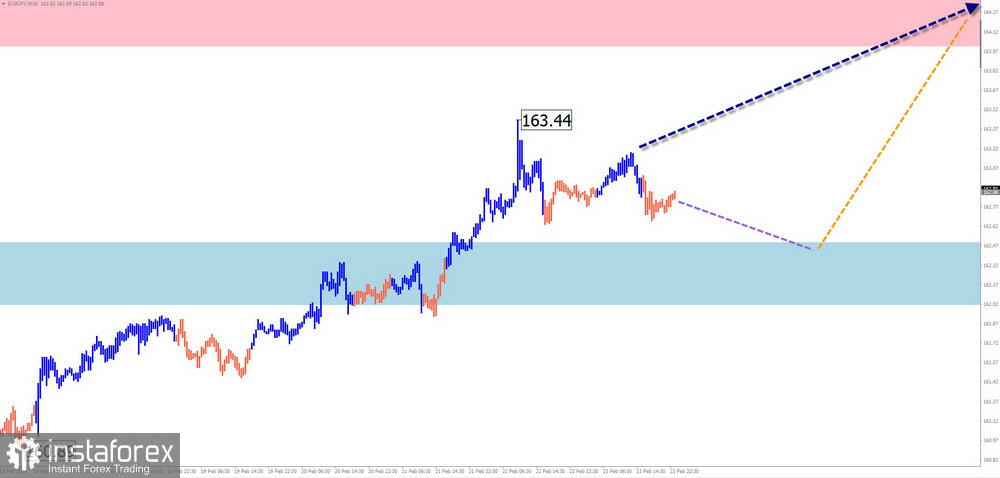
The algorithm of an ascending wave sets the trend direction from a short-term perspective since December 7th of the previous year. The wave structure at the time of the analysis does not show completeness. As a result of the price rise, quotes pushed through the lower boundary of a wide potential reversal zone in the weekly timeframe. No immediate reversal signals are observed on the chart.
Forecast:
The overall upward sentiment of the price movement is expected to continue throughout the upcoming week. In the first few days, pressure on the support zone is not excluded. The resumption of the upward movement can be expected in the second half of the week. The calculated support indicates the upper boundary of the expected weekly range of the pair.
Potential Reversal Zones:
Resistance:
- 164.00/164.50
Support:
- 162.60/162.10
Recommendations:
Selling: This may be risky and lead to losses due to limited potential.
Buying: Trading opportunities may arise after the appearance of corresponding reversal signals in the support area.
EUR/CHF
Analysis:
The direction of the price movement of the euro/Swiss franc pair for many years sets the main course for the pair's quotes "south" of the price chart. Movements do not go beyond the correction of recent trend sections. The last, unfinished similar movement section starts counting from the beginning of the year. Quotes have reached the boundaries of the potential reversal zone. The structure of the wave zigzag looks completed. No immediate reversal signals are observed on the chart.
Forecast:
At the beginning of the upcoming week, pressure on the pair's price towards the resistance zone is expected. A brief breach of its upper boundary is possible. Closer to the weekend, a change in direction and the beginning of a downward trend in quotes can be expected.
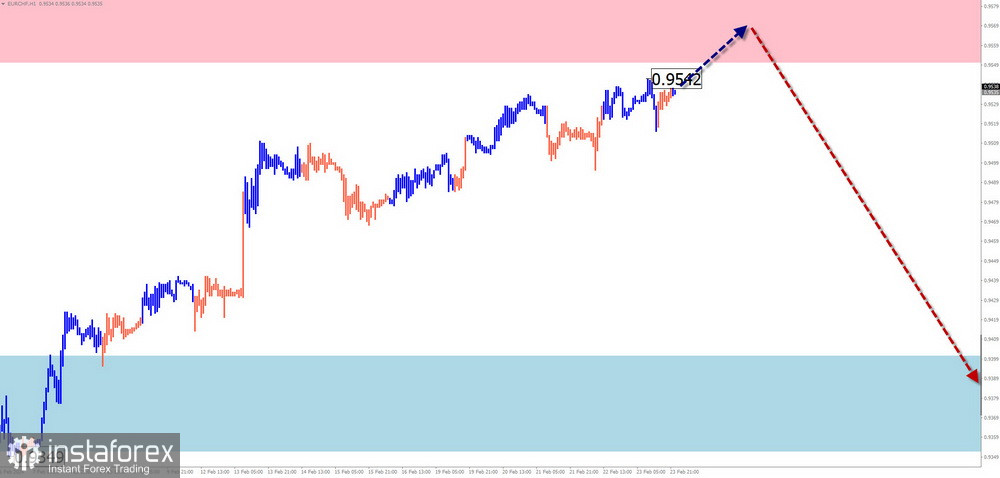
Potential Reversal Zones:
Resistance:
- 0.9550/0.9600
Support:
- 0.9400/0.9350
Recommendations:
Buying: Have no potential and may result in losses.
Selling: This will be relevant after the appearance of confirmed corresponding reversal signals in the resistance area.
US dollar index
Analysis:
Since the beginning of the current year, the North American currency index has resumed its upward movement toward the upper boundary of the chart. Since the beginning of February, the index rate has been correcting. The figure formed on the chart has created an elongated flat. Quotes are at the lower edge of the formed price channel during this time. The upward segment from February 22nd has reversal potential.
Forecast:
In the first half of the upcoming week, one can expect an overall sideways index movement. Then, a resumption of the index rate growth is likely. The calculated resistance demonstrates the upper boundary of the expected weekly range.
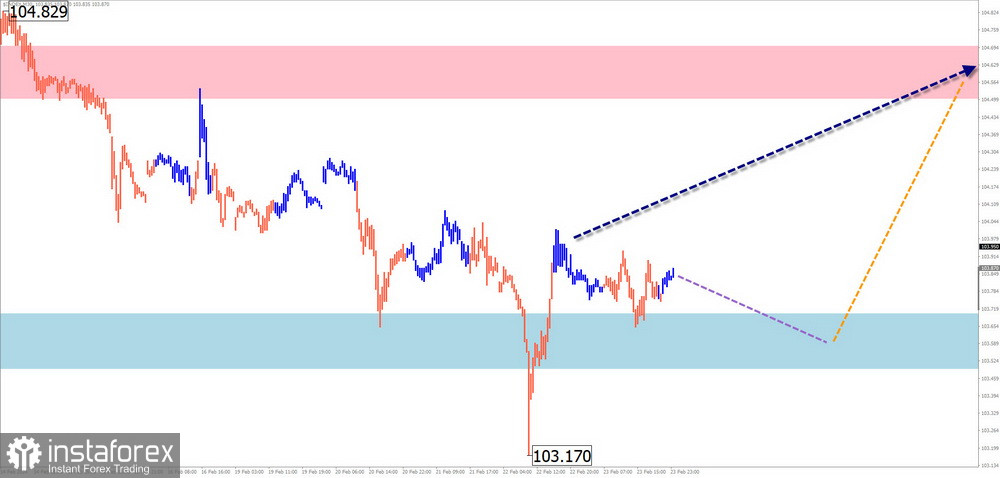
Potential Reversal Zones:
Resistance:
- 104.50/104.70
Support:
- 103.70/103.50
Recommendations:
Buying: This will be possible only after the appearance of reversal signals in the resistance area.
Selling: Has limited potential and is quite risky.
Note: In simplified wave analysis (SWA), all waves consist of 3 parts (A-B-C). The last unfinished wave is analyzed on each timeframe. Dotted lines indicate expected movements.
Attention: The wave algorithm does not consider the duration of instrument movements over time!


