


Trend analysis
GBP/USD may continue to increase this week, rising from 1.2667 (closing price of the last weekly candle) to the historical resistance level of 1.2761 (blue dashed line). Following this, it could climb further towards the 76.4% retracement level of 1.2880 (red dashed line).
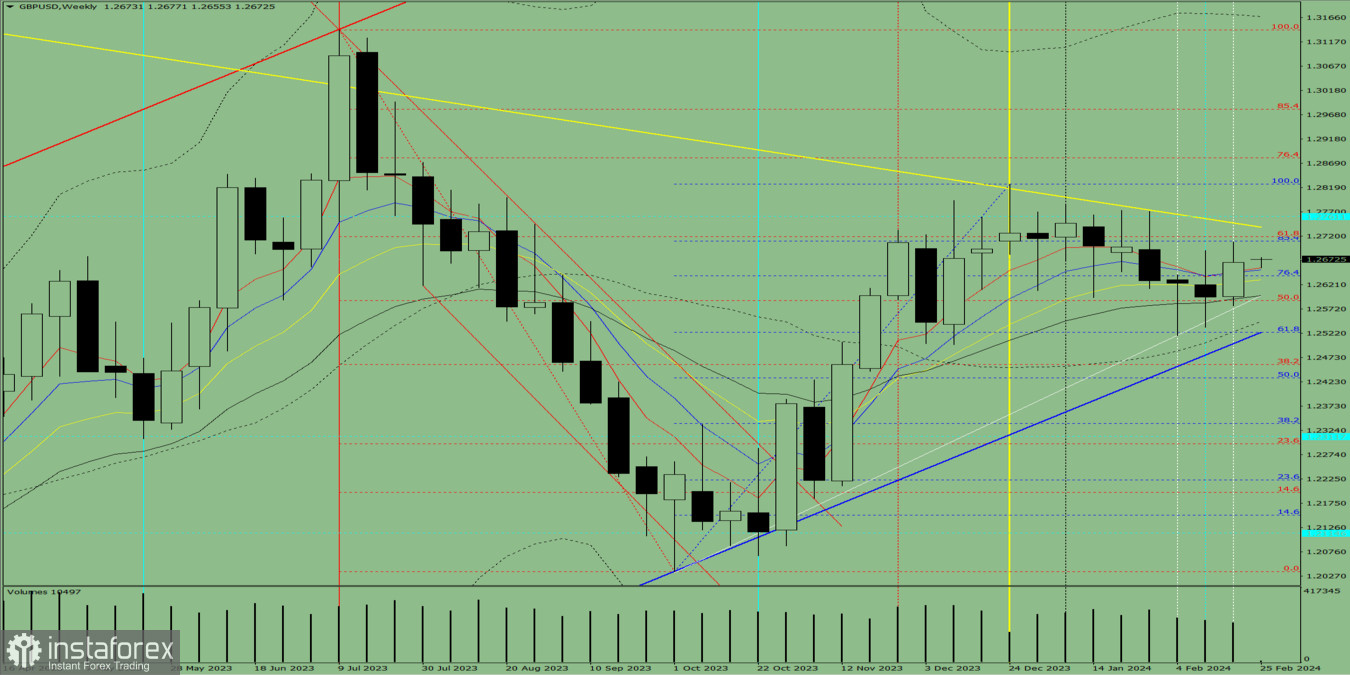
Fig. 1 (weekly chart)
Comprehensive analysis:
Indicator analysis - upward
Fibonacci levels - upward
Volumes - upward
Candlestick analysis - upward
Trend analysis - upward
Bollinger bands - upward
Monthly chart - upward
Conclusion: The indicators point to an upward movement in GBP/USD.
Overall conclusion: The pair will have a bullish trend, with no first lower shadow on the weekly white candle (Monday - upward) and a second upper shadow (Friday - downward).
So, during the week, pound will climb from 1.2667 (closing price of the last weekly candle) to the historical resistance level of 1.2761 (blue dashed line), and then approach the 76.4% retracement level of 1.2880 (red dashed line).
Alternatively, it could rise from 1.2667 (closing price of the last weekly candle) to the historical resistance level of 1.2761 (blue dashed line), followed by a pullback towards the 85.4% retracement level of 1.2710 (red dashed line).


