EUR/USD

Higher Timeframes
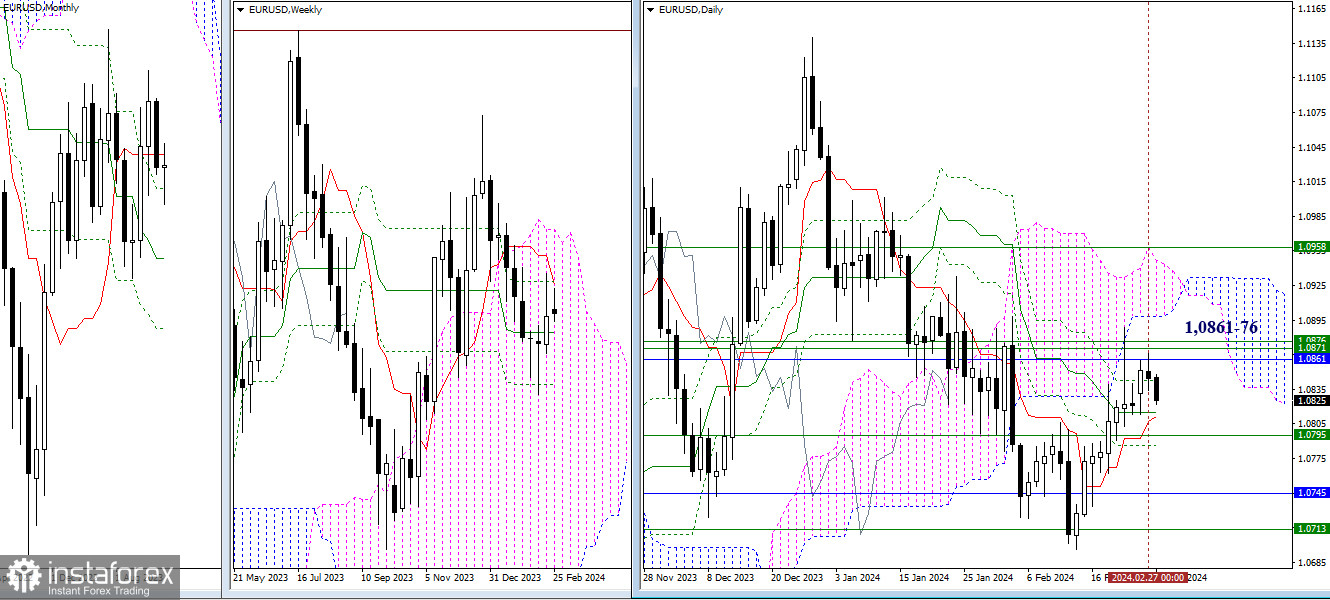
Yesterday, bullish players again failed to break through the nearest and strong resistance zone of 1.0861 – 1.0876 (monthly short-term trend + weekly levels). Today, the opponent has already updated the low of the previous day and is attempting to develop a decline. Along the downward trajectory, the current presence of the daily Ichimoku cross (1.0815 – 1.0811 – 1.0787), supported by the weekly medium-term trend (1.0795), adds strength. A breakthrough and a dependable consolidation beneath these levels will open up new possibilities for the development of bearish sentiments.

H4 – H1
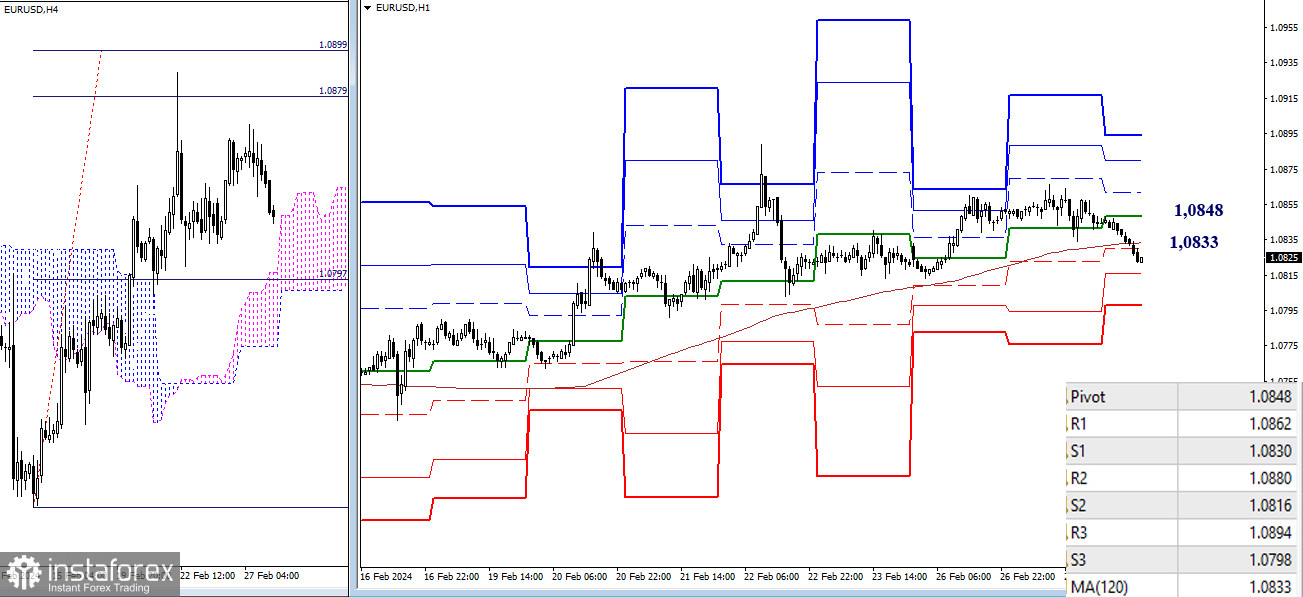
On the lower timeframes, the bears are busy trying to consolidate and develop their advantages below key levels, which can be marked today at 1.0848 (central pivot point of the day) and 1.0833 (weekly long-term trend). Working below the trend and its reversal will change the current balance of power, which may lead to further development of the downward movement. Intraday support may be provided today by S2 (1.0816) and S3 (1.0798).
***
GBP/USD

Higher Timeframes
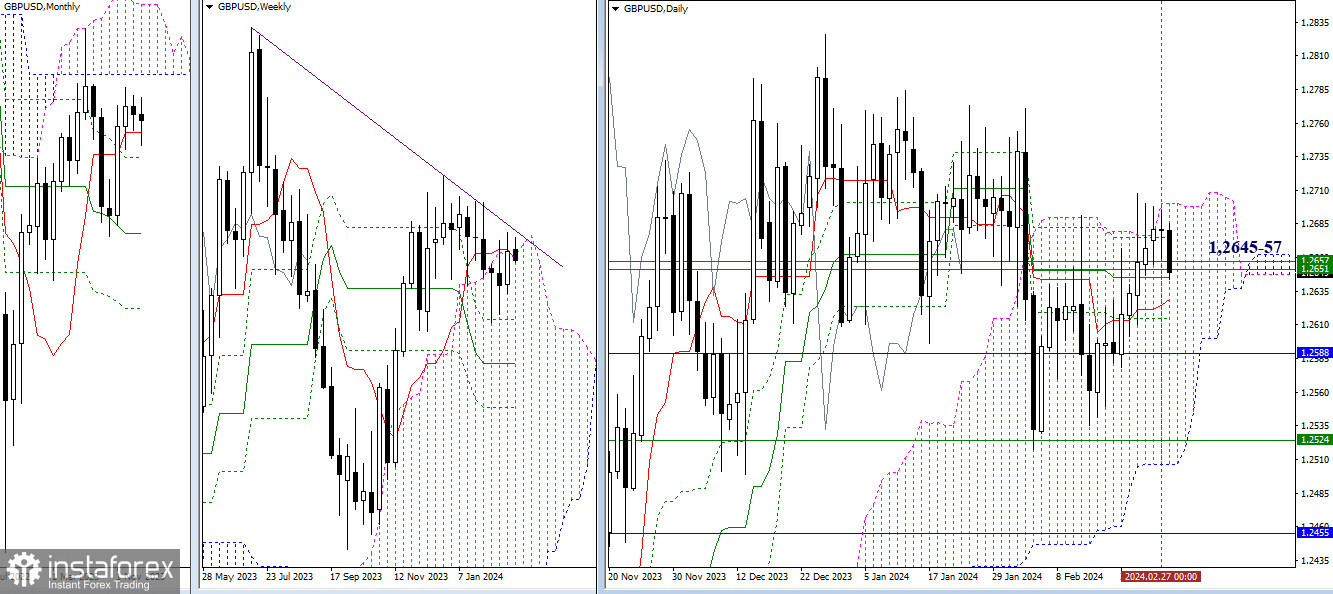
Yesterday, the bulls faced another setback in breaking free from the daily cloud. Consequently, the market reverted to the support zones of weekly levels and the daily medium-term trend (1.2645-57). Overcoming these supports will allow testing the next daily levels 1.2628 – 1.2615, and then the question of returning to the bearish side of the monthly short-term trend (1.2588) will arise.

H4 – H1
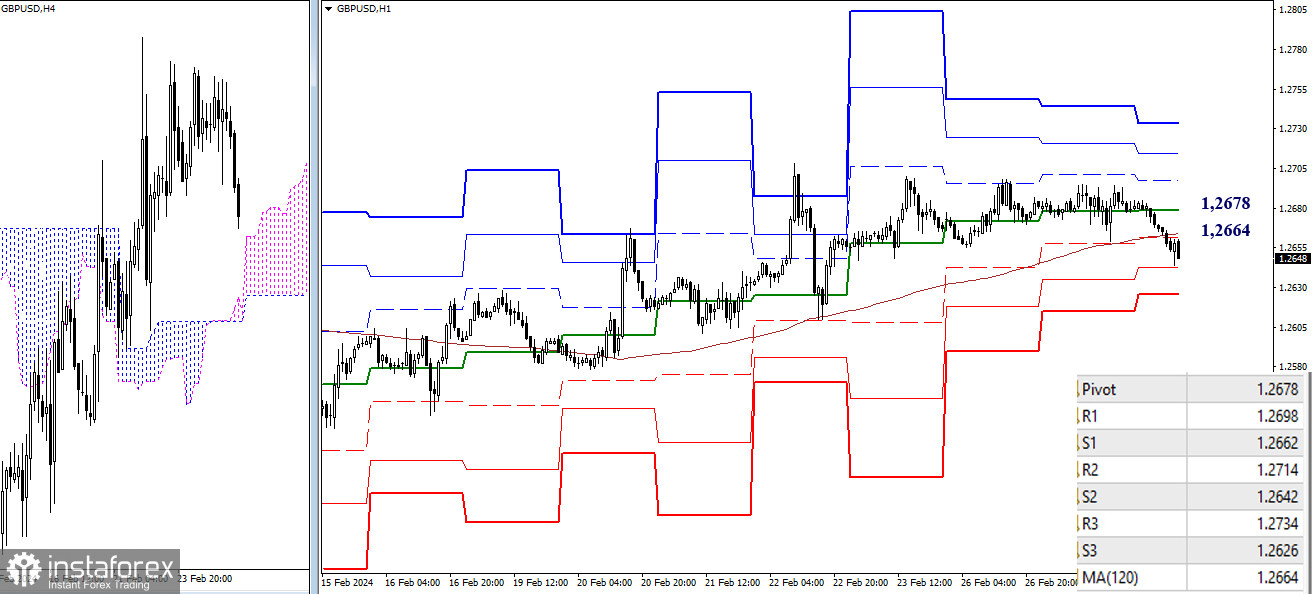
On the lower timeframes, the bears have taken hold of key levels at 1.2678 – 1.2664 (central pivot point of the day + weekly long-term trend), and continue the decline. The next step involves testing support levels at classic pivot points S2 (1.2642) and S3 (1.2626). Subsequently, attention will shift to the H4 cloud (1.2613-22), and following that, levels of support on higher timeframes can be taken into consideration. If the decline is halted, the immediate objective for the bullish players will be to reclaim the key levels of 1.2678-64. In case of consolidation above, bulls will regain dominance and strive to strengthen bullish influence.
***
The technical analysis of the situation uses:
Higher timeframes - Ichimoku Kinko Hyo (9.26.52) + Fibonacci Kijun levels
Lower timeframes - H1 - Pivot Points (classic) + Moving Average 120 (weekly long-term trend)


