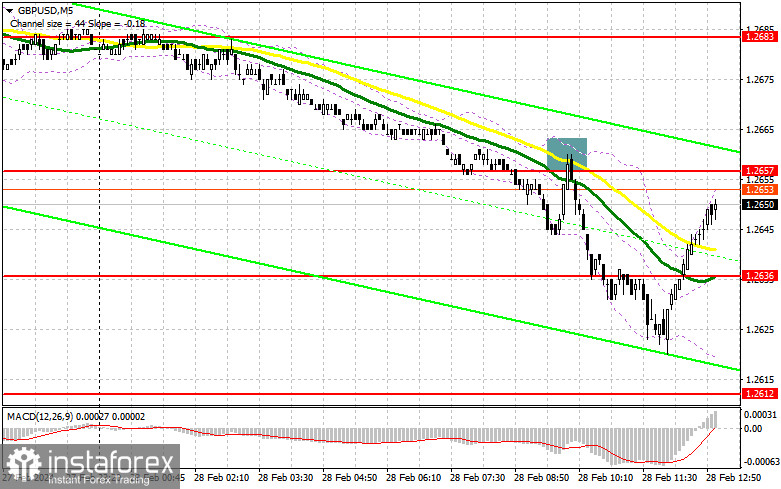
In my morning forecast, I turned your attention to the level of 1.2657 and planned to make decisions on entering the market from it. Let's look at the 5-minute chart and figure out what happened there. The breakout and reverse test of this area produced an excellent entry point to sell the pound. As a result, GBP/USD fell by more than 35 pips. In the afternoon, the technical picture was slightly revised.

What is needed to open long positions on GBP/USD
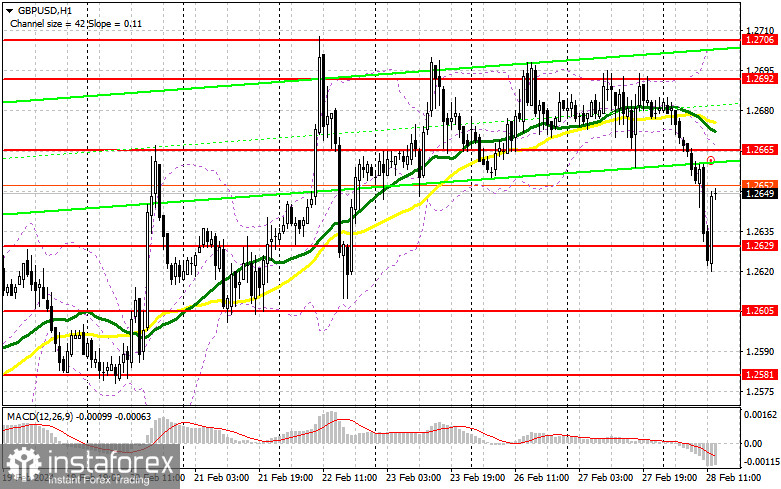
US data will determine a further direction of GBP/USD. The second estimate of the US GDP for the fourth quarter of 2023 is unlikely to be significantly revised. So, there's practically no chance for the pound buyers. If the US GDP turns out to be even better than the preliminary data, the currency pair will remain under selling pressure. Speeches by FOMC members Raphael Bostic and John Williams will likely have a hawkish tone, which will also benefit the dollar buyers. The strong US GDP data will weaken the pound sterling. Hence, GBP/USD will update the nearest support at 1.2629, formed in the first half of the day. Only a false breakout at this level will provide a suitable entry point for long positions. The buyers will be interested in the GBP/USD's recovery to the area of 1.2665. A breakout and consolidation above this area will encourage demand for the pound and open the path to 1.2692. The furthest target will be the high of 1.2706, where I plan to take profits. The bears will continue sell-offs in a scenario of the GBP/USD's decline and lack of activity from the bulls at 1.2629. In this case, only a false breakout in the area of the next support at 1.2605 will confirm the correct entry point into the market. I plan to buy GBP/USD immediately on a dip from the low of 1.2581, aiming for a 30-35 pips correction within the day.
What is needed to open short positions on GBP/USD
The sellers performed great in the first half of the day. In case of a rise in GBP/USD, I plan to act only after a false breakout around the new resistance at 1.2665, similar to what I analyzed above. Traders will decide to open short positions with the aim of a slight decrease in the price to 1.2629, the support formed in the first half of the day. A breakout and a reverse test from below upwards of this area in light of hawkish comments from the Federal Reserve's policymakers will strike another blow to the bulls' positions, leading to the activation of their stop orders. This will open a path to 1.2605, where I expect large buyers to enter the market. The highest target will be 1.2581, where profits will be taken. In the scenario of a rise in GBP/USD and lack of activity at 1.2665 in the second half of the day, the buyers will bring the market to their side. In such a case, I will postpone selling until a false breakout at the level of 1.2692. If there is no downward movement there, I will sell GBP/USD immediately on a rebound from 1.2706, but only aiming for a correction of GBP/USD down by 30-35 pips within the day.

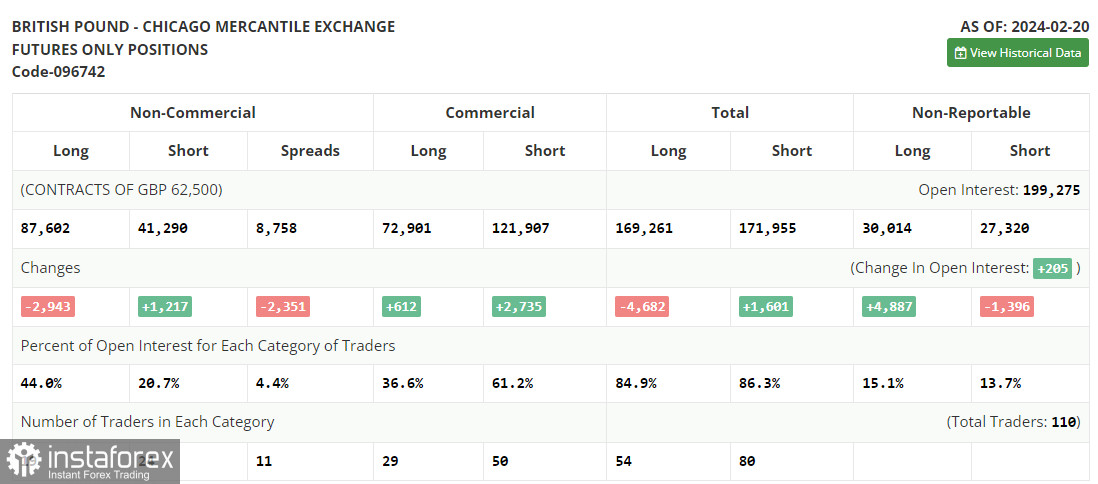
In the COT report (Commitment of Traders) for February 20th, there was an increase in short positions and a decrease in long positions. The recent statements by the Bank of England officials that interest rates could be lowered even if inflation does not reach the targeted 2.0% are clearly not reflected in this report. So, it should not be taken too seriously. However, despite this, the pound continues to grow, although, as the latest data show, it could end its rise at any moment, especially due to the current hawkish stance of the Federal Reserve. The latest COT report indicates that non-commercial long positions decreased by 2,934 to 87,602, while non-commercial short positions increased by 1,217 to 41,290. Consequently, the spread between long and short positions narrowed by 2,351.

Indicators' signals
Moving averages
The instrument is trading above the 30 and 50-day moving averages. It indicates that the pound sterling is making efforts to grow.
Note: The period and prices of the moving averages are considered by the analyst on the 1-hour chart and differ from the general definition of classic daily moving averages on the daily chart.
Bollinger Bands
In case GBP/USD goes down, the indicator's lower border at about 1.2666 will act as support.
Description of indicators
- Moving average (moving average, determines the current trend by smoothing out volatility and noise). Period 50. It is marked yellow on the chart.
- Moving average (moving average, determines the current trend by smoothing out volatility and noise). Period 30. It is marked green on the chart.
- MACD indicator (Moving Average Convergence/Divergence — convergence/divergence of moving averages) Quick EMA period 12. Slow EMA period to 26. SMA period 9
- Bollinger Bands (Bollinger Bands). Period 20
- Non-commercial speculative traders, such as individual traders, hedge funds, and large institutions that use the futures market for speculative purposes and meet certain requirements.
- Long non-commercial positions represent the total long open position of non-commercial traders.
- Short non-commercial positions represent the total short open position of non-commercial traders.
- Total non-commercial net position is the difference between short and long positions of non-commercial traders.


