


EUR/USD
Higher Timeframes
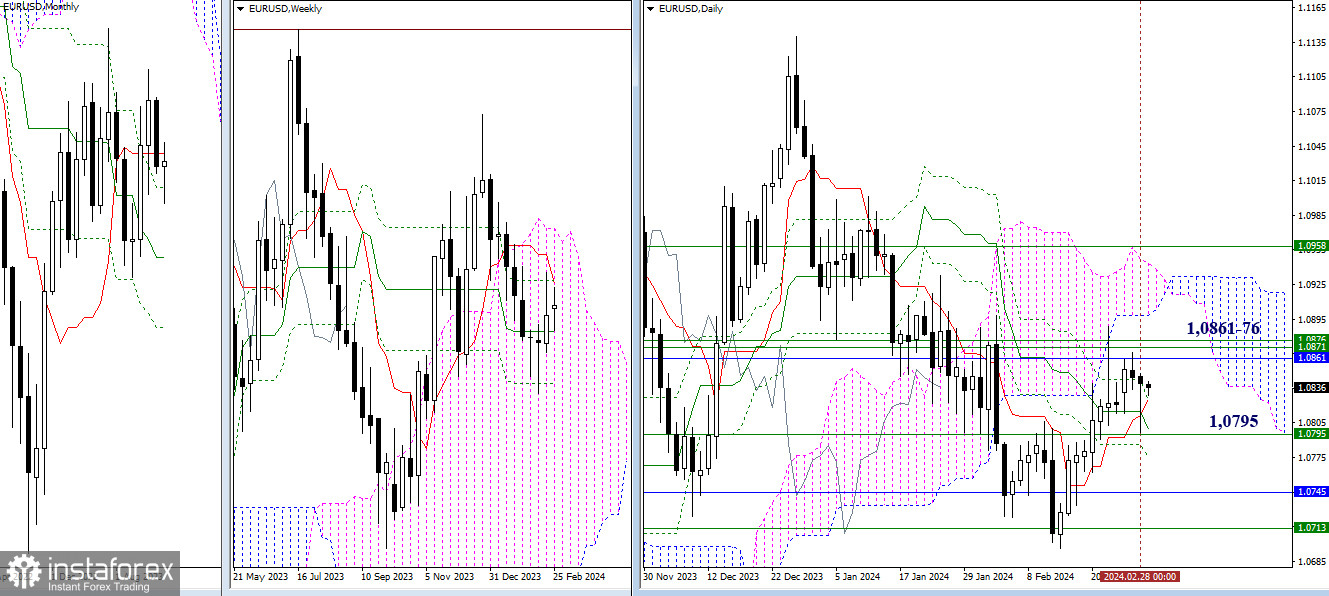
The testing of the weekly medium-term trend (1.0795) concluded with a long lower shadow on the daily candle. Bears did not maintain control of the situation and failed to make significant changes to it. Today, the supports remain the same, although they have slightly shifted their position. A daily golden cross of Ichimoku has formed (1.0825 – 1.0799), which continues to strengthen the weekly medium-term trend (1.0795). For bulls, the primary task at the moment is the accumulation of resistances in the area of 1.0861–76 (weekly levels + monthly short-term trend).
H4 – H1
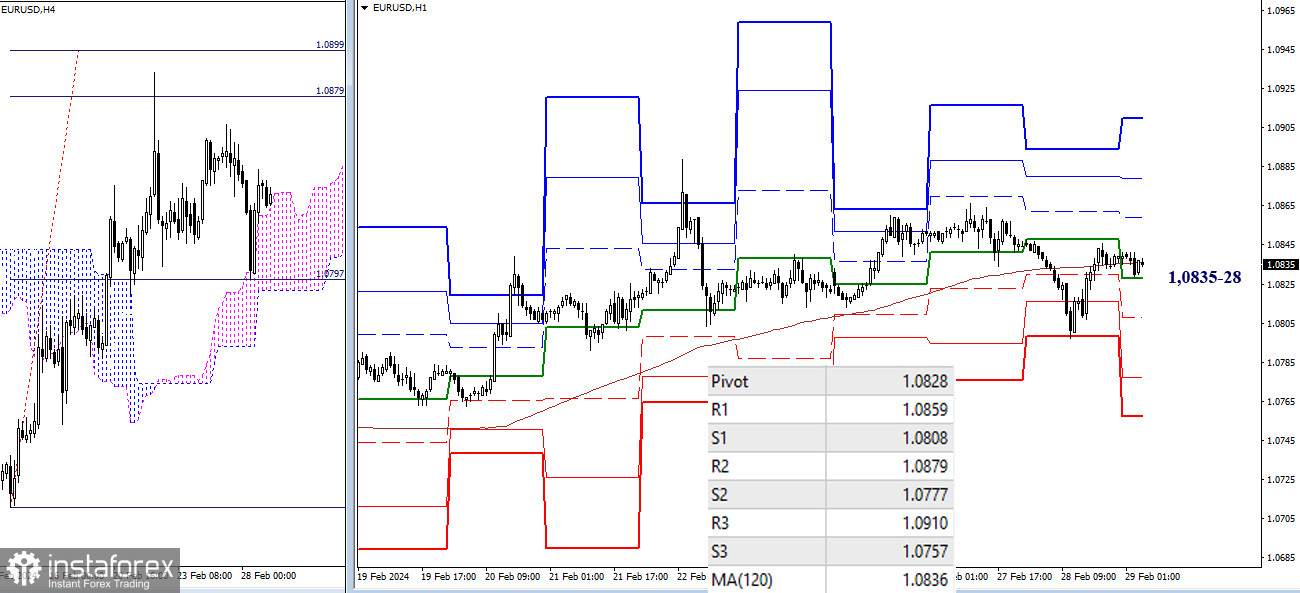
On the lower timeframes, the market returned to the attraction and influence zone of key levels 1.0835 – 1.0828 (central pivot point + weekly long-term trend). Prolonged presence here will create uncertainty. The unfolding events will allow breaking beyond the key levels, favoring one side. Thus, a prevalence of bearish sentiments will lead to intraday testing of support levels of classic pivot points (1.0808 – 1.0777 – 1.0757), while the development of bullish opportunities will involve overcoming resistances of classic pivot points (1.0859 – 1.0879 – 1.0910).
***
GBP/USD
Higher Timeframes
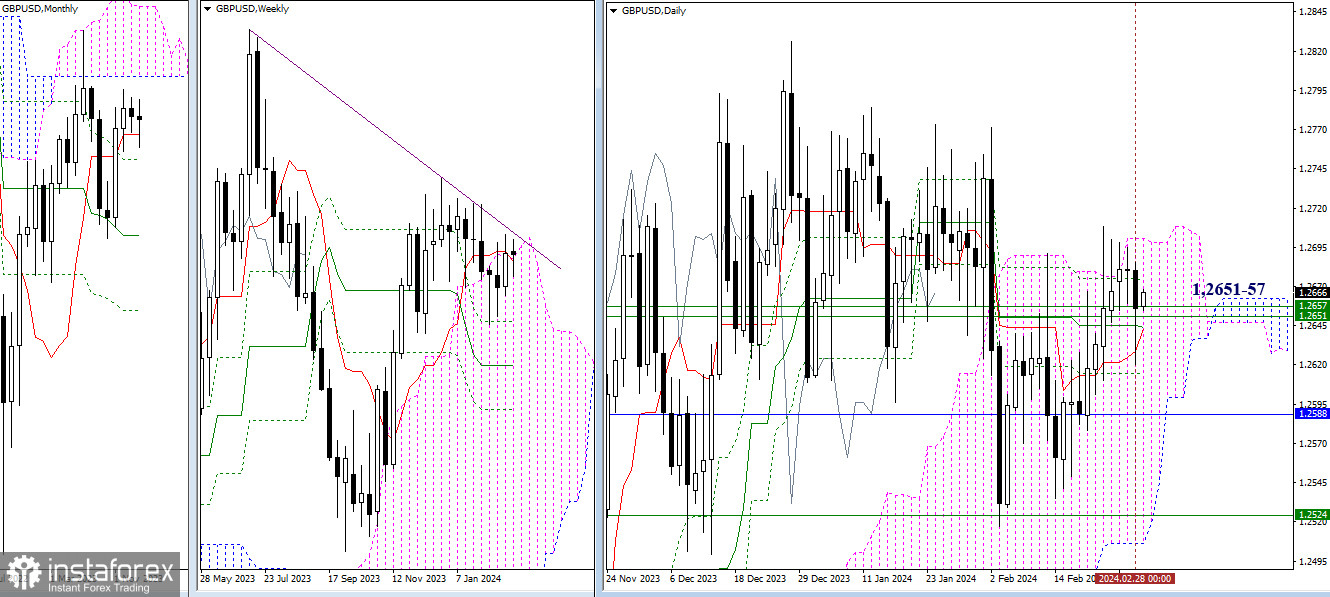
Yesterday's decline was effective, but it couldn't be sustained; the market returned to the zone of weekly levels 1.2651–57. Consequently, for the situation to develop favorably for bulls, it remains crucial to go beyond the daily cloud (1.2701), firmly consolidating in the bullish zone of relative weekly and daily clouds. For bears, everything continues to hinge on weekly levels (1.2651–57) and the daily Ichimoku cross (1.2644-14).
H4 – H1
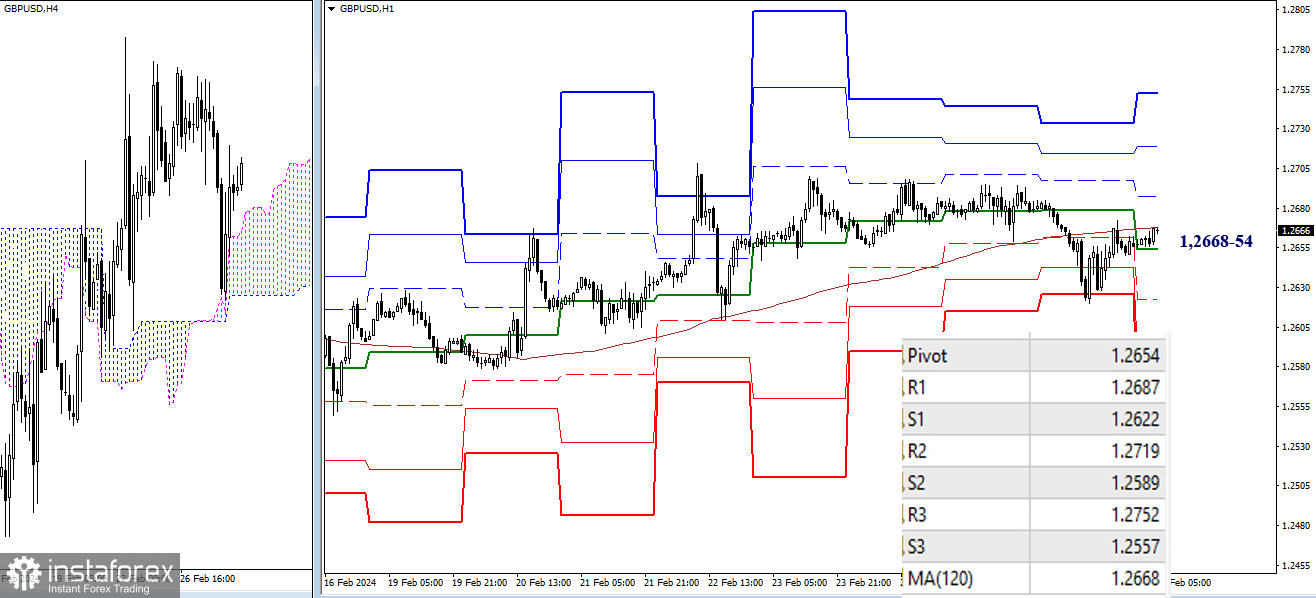
The market once again tests the key levels at 1.2668–54 (central pivot point + weekly long-term trend) on the lower timeframes. Should the bulls gain control of the situation, they must surpass the resistances of classic pivot points (1.2687 – 1.2719 – 1.2752) to execute the upward movement. Conversely, if bears persist in advancing their position, their intraday reference points will be the supports of classic pivot points (1.2622 – 1.2589 – 1.2557).
***
The technical analysis of the situation uses:
Higher timeframes - Ichimoku Kinko Hyo (9.26.52) + Fibonacci Kijun levels
Lower timeframes - H1 - Pivot Points (classic) + Moving Average 120 (weekly long-term trend)


