


Trend analysis:
GBP/USD may start moving upward in March, rising from the closing of the February monthly candle at 1.2619 to the resistance line located at 1.2833 (bold yellow line). After that, it will climb to the upper fractal located at 1.3141 (yellow dashed line).
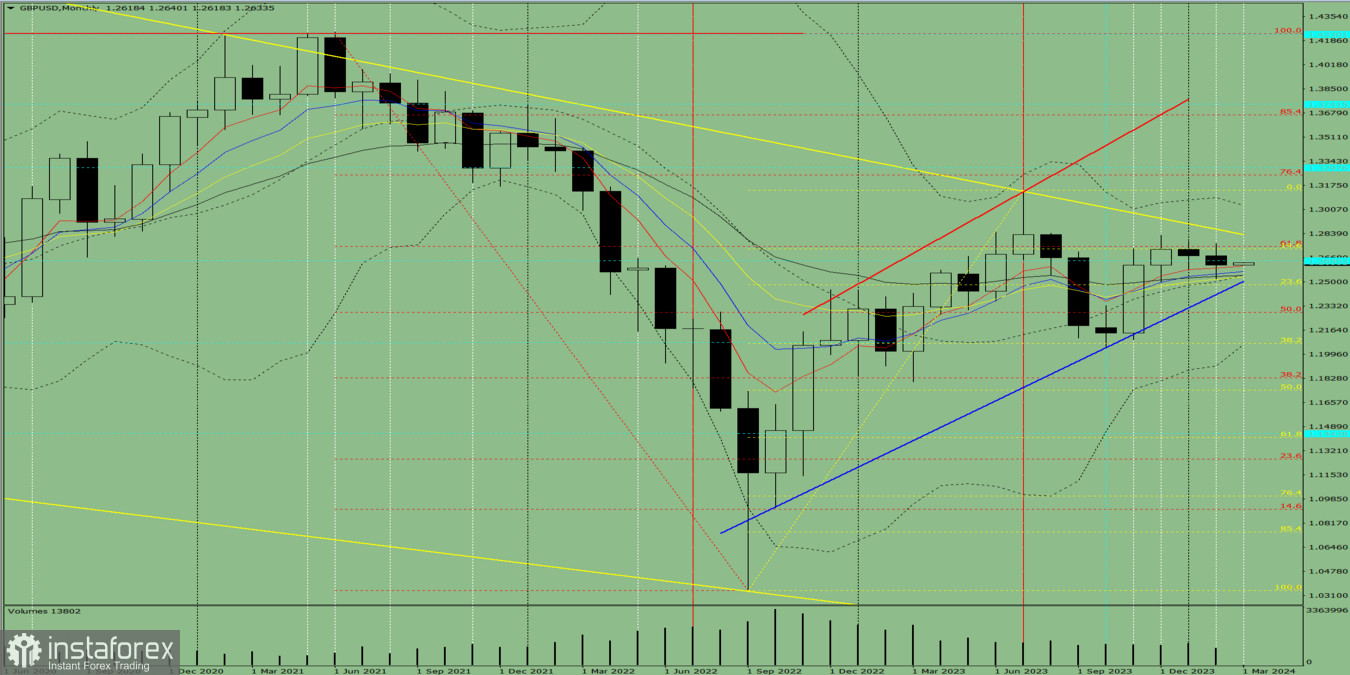
Fig. 1 (monthly chart)
Comprehensive analysis:
Indicator analysis - uptrend
Fibonacci levels - uptrend
Volumes - uptrend
Candlestick analysis - uptrend
Trend analysis - uptrend
Bollinger bands - uptrend
Conclusion: All signals point to an upward movement in GBP/USD.
Overall conclusion: The pair will have a bullish trend, with no first lower shadow on the monthly white candle (first week of month - white) and no second upper shadow (last week of the month - black).
Therefore, for this month, pound will rise from 1.2619 (closing of the February monthly candle) to the resistance line located at 1.2833 (bold yellow line), and then climb further to the upper fractal located at 1.3141 (yellow dashed line).
Alternatively, it could go up from 1.2619 (closing of the February monthly candle) to the resistance line located at 1.2833 (bold yellow line), followed by a decline to the historical support level of 1.2650 (yellow dashed line).


