


Analysis of EUR/USD 5M
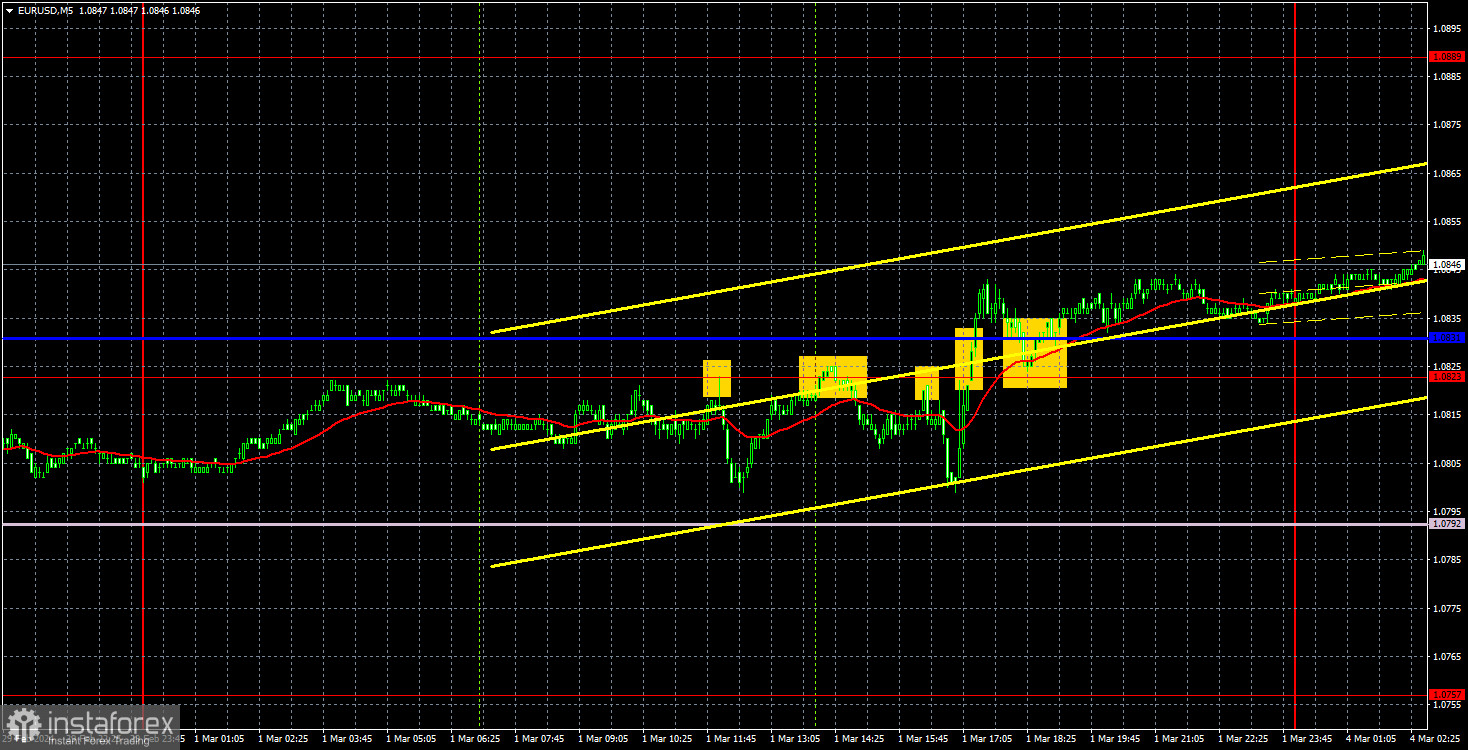
Last Friday, EUR/USD pleased us with another series of movements with volatility of about 45 pips. Despite at least three fairly important reports during the day, and the market even reacted to them, we still did not see strong trends. Therefore, we can only say that the EUR/USD is also flat, and volatility is low regardless of the fundamental and macroeconomic background.
We found out that eurozone inflation increased moderately in February, as consumer prices rose at an annual rate of 2.6%, which is slightly higher than forecasted. In fact, it was a minor deviation from the forecast, and the current inflation value is still low enough to expect the European Central Bank to lower rates as early as this summer. Thus, the fact that inflation slightly exceeded forecasts should not have disappointed traders and this should have triggered the euro's rise instead.
However, the US reports turned out to be noticeably weaker than forecasts. The ISM business activity index and the University of Michigan consumer sentiment index showed values that could not support the dollar bulls. The market reacted to the reports by selling the dollar by a solid 30 pips. We saw a logical and adequate market reaction to the economic reports, but this reaction did not affect the overall trend and the general nature of movement.
There were several trading signals on Friday. The price bounced off the level of 1.0823 three times, and it failed to reach the Senkou Span B line, which was 30 pips below... Thus, traders could work with these signals, but all trades closed with a stop loss to breakeven. It didn't make sense to work with subsequent signals in the same area, as all the previous ones turned out to be false signals.
COT report:
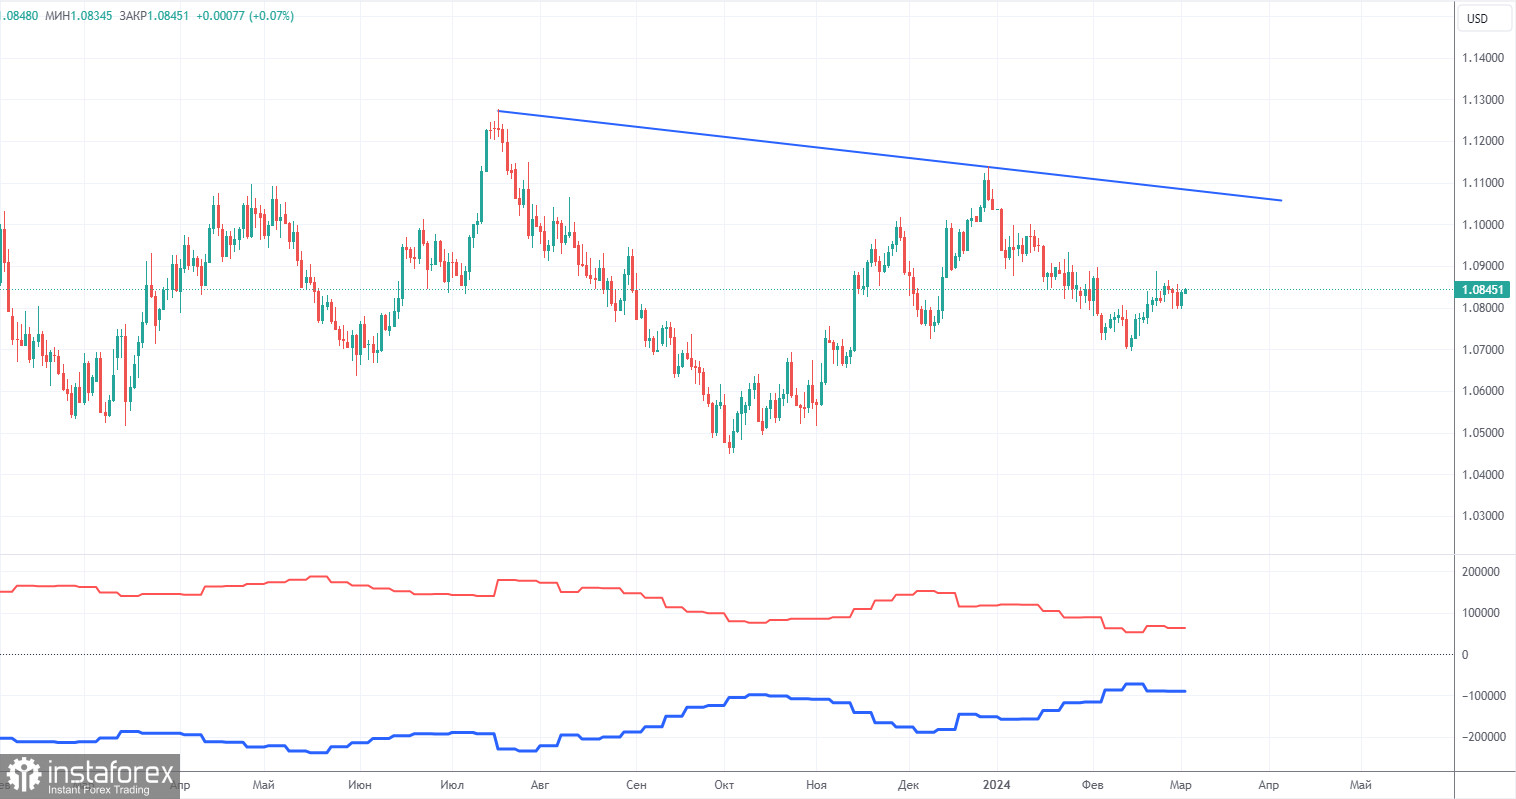
The latest COT report is dated February 27. The net position of non-commercial traders has been persistently bullish for quite some time. Basically, the number of long positions in the market is higher than the number of short positions. However, at the same time, the net position of non-commercial traders has been decreasing in recent months, while that of commercial traders has been increasing. This shows that market sentiment is turning bearish, as speculators are increasing the volume of short positions on the euro. We don't see any fundamental factors that can support the euro's growth in the long term, while technical analysis also points to the formation of a downtrend.
We have already drawn your attention to the fact that the red and blue lines have significantly diverged, often preceding the end of a trend. Currently, these lines are moving towards each other (indicating a trend change). Therefore, we believe that the euro will fall further. During the last reporting week, the number of long positions for the non-commercial group decreased by 7,900, while the number of short positions decreased by 2,800. Accordingly, the net position decreased by 5,100. The number of buy contracts is still higher than the number of sell contracts among non-commercial traders by 63,000 (previously 68,000). Therefore, commercial traders continue to sell the euro.
Analysis of EUR/USD 1H
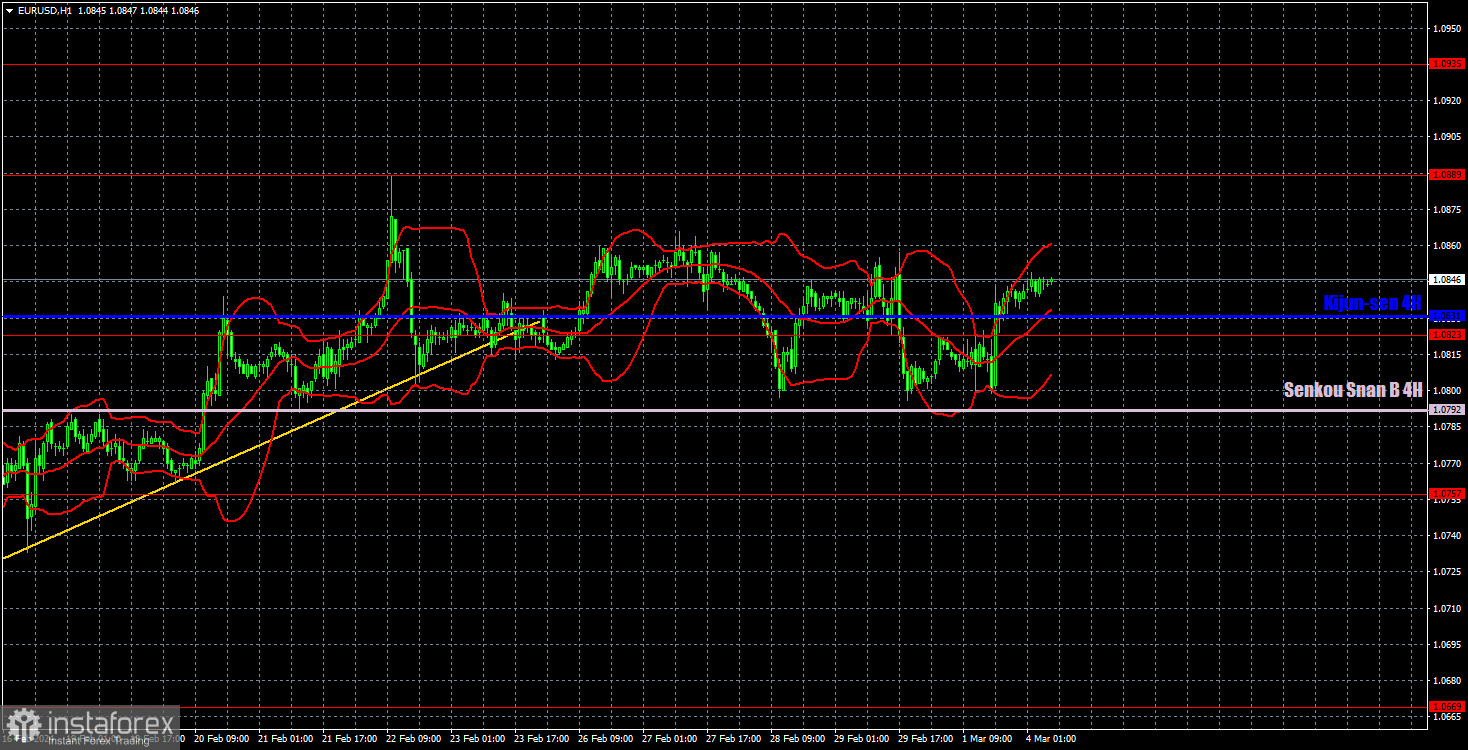
On the 1-hour chart, the uptrend remains intact, but we are skeptical about it. In our opinion, all the factors currently suggest that the dollar will strengthen. Therefore, we expect the price to consolidate below the Senkou Span B line and the euro to revive the downward movement. The nearest target is the area of 1.0658-1.0669. However, if the market continues to trade in this manner, it will take a very long time until we see any trend.
On March 4, we highlight the following levels for trading: 1.0530, 1.0581, 1.0658-1.0669, 1.0757, 1.0823, 1.0889, 1.0935, 1.1006, 1.1092, as well as the Senkou Span B line (1.0792) and the Kijun-sen (1.0831). The Ichimoku indicator lines can move during the day, so this should be taken into account when identifying trading signals. Don't forget to set a Stop Loss to breakeven if the price has moved in the intended direction by 15 pips. This will protect you against potential losses if the signal turns out to be false.
On Monday, there are no interesting events planned in the European Union or the United States. However, later this week, there will be a significant number of important events and reports. The question is, will they trigger an increase in volatility and push traders to be more active? For now, the flat trend persists.
Description of the chart:
Support and resistance levels are thick red lines near which the trend may end. They do not provide trading signals;
The Kijun-sen and Senkou Span B lines are the lines of the Ichimoku indicator, plotted to the 1H timeframe from the 4H one. They provide trading signals;
Extreme levels are thin red lines from which the price bounced earlier. They provide trading signals;
Yellow lines are trend lines, trend channels, and any other technical patterns;
Indicator 1 on the COT charts is the net position size for each category of traders;
Indicator 2 on the COT charts is the net position size for the Non-commercial group.


