


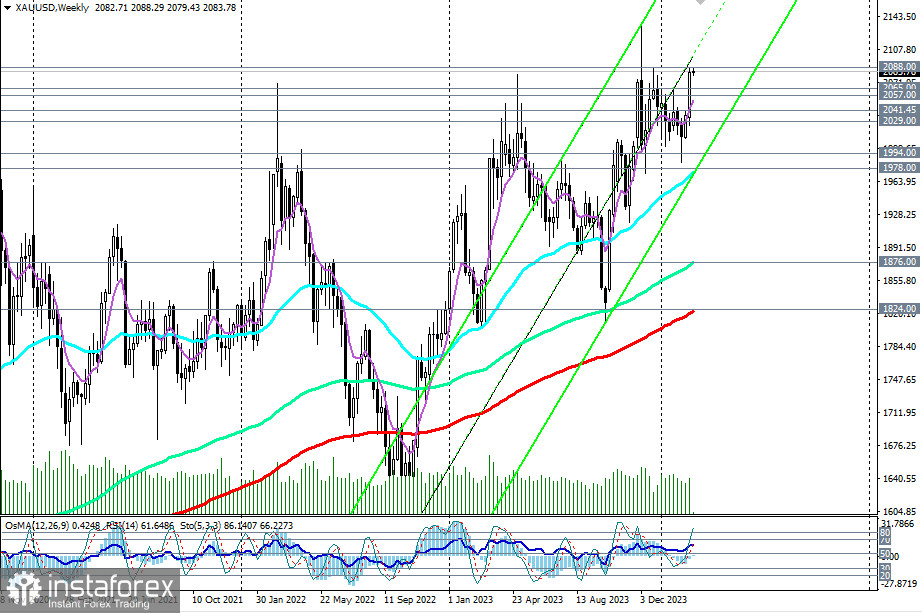
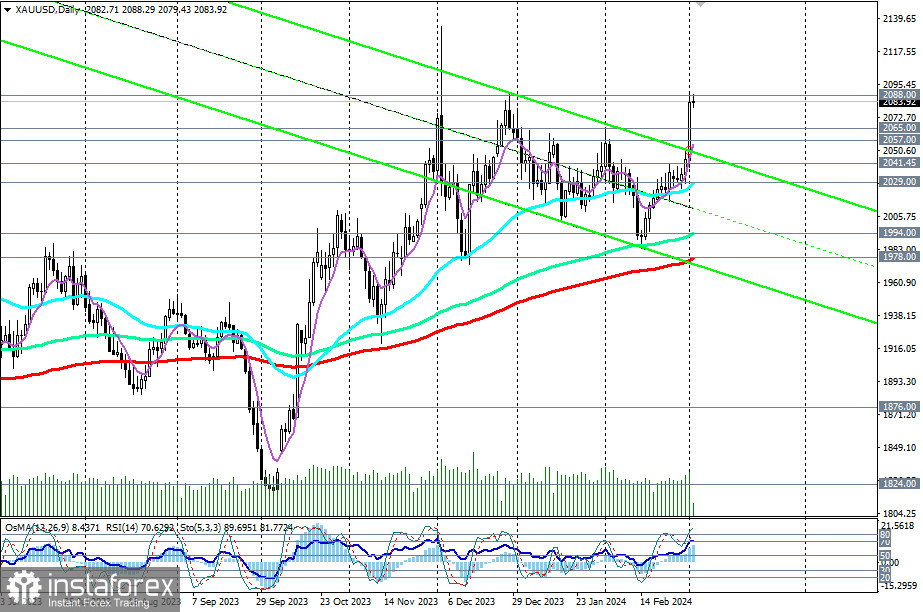
XAU/USD traded near the 2084.00 mark at the beginning of today's European trading session. Seemingly, bulls have paused, awaiting new drivers for buying and pushing the price towards the record high of 2134.00, reached in early December.
This week, the publication of crucial macroeconomic data from the U.S. and two speeches by Federal Reserve Chairman Jerome Powell in Congress are expected. These events could provide gold quotes and the XAU/USD pair with a new impetus.
The question remains whether it will be positive or negative. Should the data exceed expectations and Powell express the necessity to persist in combating the persistently high inflation, suggesting the maintenance of interest rates at elevated levels for an extended duration, it would signal an anticipated downturn for XAU/USD.
In this case, the correction may have a significant lag, possibly reaching the support level of 2029.00 (50 EMA on the daily chart). Intermediate targets are located at support levels of 2065.00, 2057.00, 2042.00 (200 EMA on the 1-hour chart).
Further decline and a breakthrough of medium-term support levels at 1978.00 (200 EMA on the daily chart), 1974.00 (50 EMA and the lower line of the upward channel on the weekly chart) will direct XAU/USD towards the key support level of 1824.00 (200 EMA on the weekly chart). Its breakthrough will lead XAU/USD into a long-term bearish market zone.
In an alternative scenario, the price will overcome the level of 2088.00 and move towards the record high of 2134.00, reached in early December. However, substantial fundamental arguments are required for this. One of them (among others mentioned today) is the continuation of the decline in the yield of U.S. government bonds.
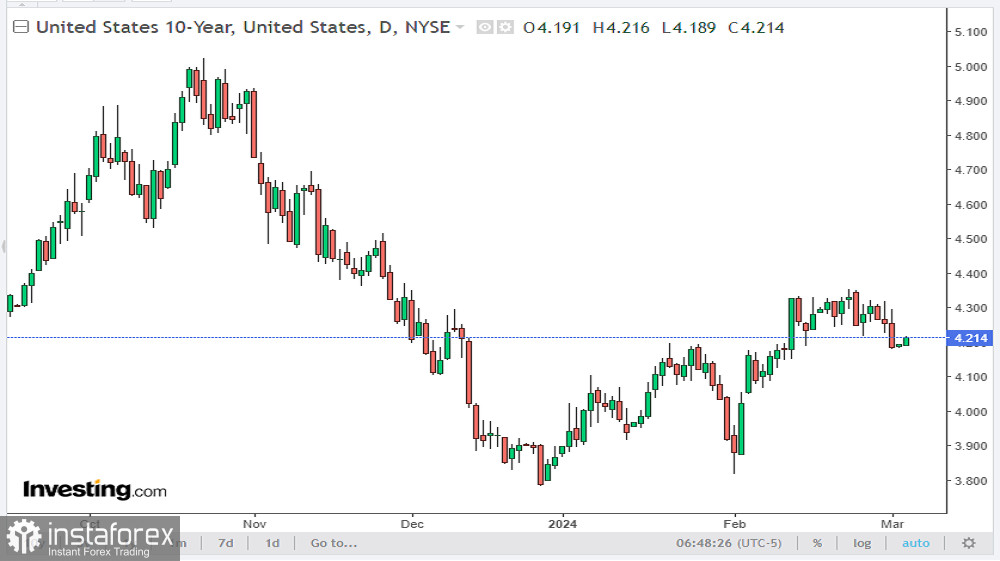
As seen from the attached chart, it is rising today.
Support levels: 2080.00, 2065.00, 2057.00, 2042.00, 2029.00, 2020.00, 2000.00, 1984.00, 1972.00, 1900.00, 1876.00, 1824.00
Resistance levels: 2088.00, 2090.00, 2100.00, 2110.00, 2120.00, 2134.00
Trading scenarios:
Alternative scenario: Buy Stop 2089.00. Stop-Loss 2078.00. Targets: 2090.00, 2100.00, 2110.00, 2120.00, 2134.00
Main scenario: Sell Stop 2078.00. Stop-Loss 2089.00. Targets 2065.00, 2057.00, 2042.00, 2029.00, 2020.00, 2000.00, 1984.00, 1972.00, 1900.00, 1876.00, 1824.00
"Targets" correspond to support/resistance levels. This also does not mean that they will necessarily be reached, but they can serve as a guide when planning and placing your trading positions.


