


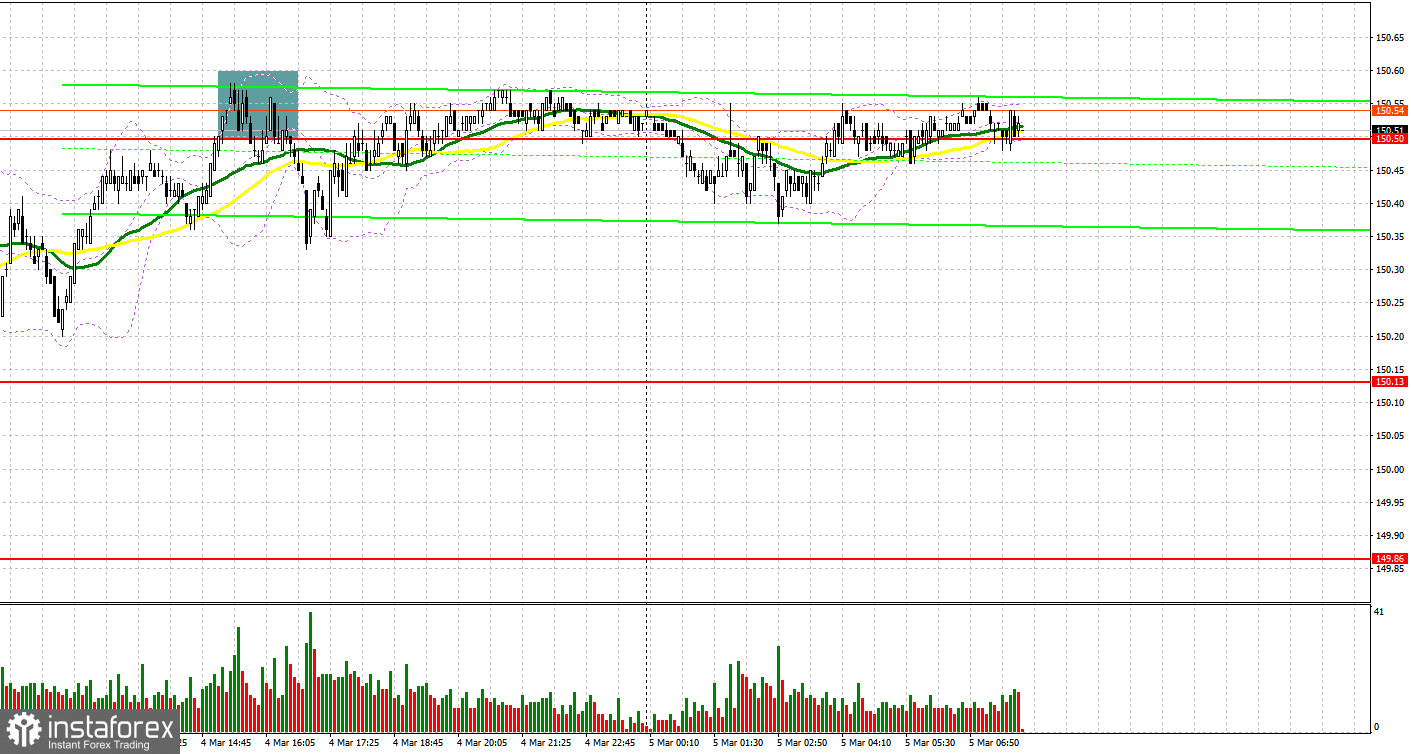
Yesterday, traders received just one signal to enter the market. Let's look at the 5-minute chart and understand what happened there. Earlier, I paid attention to the level of 150.13 to decide when to enter the market. The pair declined, but a test and a false breakdown did not happen. For this reason, it was not possible to get suitable market entry points. In the second half of the day, a false breakdown at 150.50 led to a signal to sell the dollar. However, after moving down by 17 pips, the pressure weakened, which allowed the pair to resume trading sideways.
Conditions for opening long positions on USD/JPY:
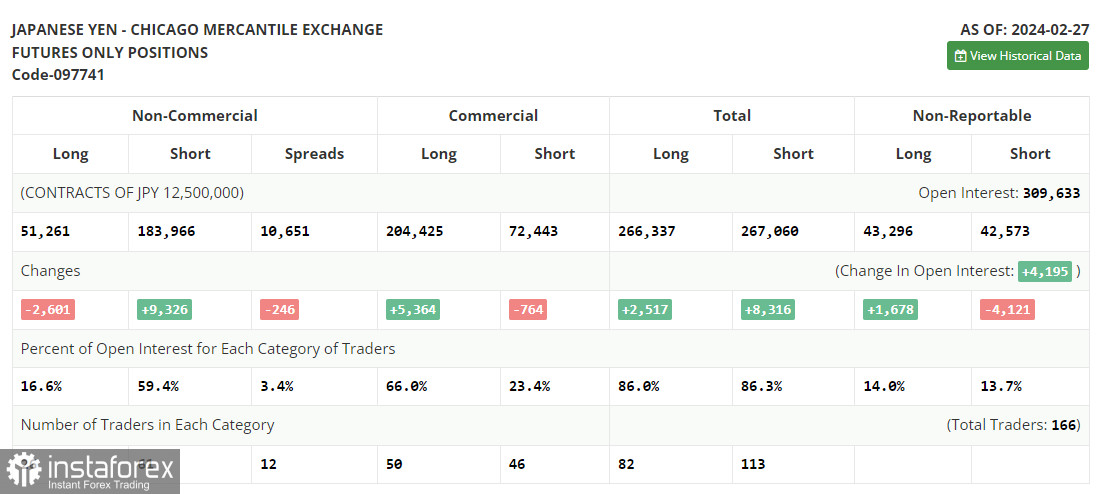
Let us first find out what happened in the futures market. According to the COT report (Commitment of Traders) for February 27, the number of short positions increased, whereas the number of long positions dropped. The dollar's price of 150 yen remains a problem for traders. First of all, it is expensive, and somewhere at this level, the Central Bank of Japan starts to intervene. However, there are absolutely no reasons to sell. Recent statements by central bank officials that policy will be brought back to normal forced traders to buy the yen, thus causing a fall in USD/JPY. The latest COT report shows that long non-commercial positions declined by 2,601 to 51,261 while short non-commercial positions jumped by 9,326 to 183,966. As a result, the spread between long and short positions fell by 246.
Tokyo's consumer price inflation for February this year has already been released today. The indicator jumped from 1.8% to 2.6%, still being below economists' forecasts. The data on manufacturing activity also had a positive impact on the yen. However, the USD/JPY pair did not make a major downward move, which indicates that there are big buyers of the dollar in the market. If the pressure on the pair returns, I will act near the support at 150.21. A false breakdown there will give a suitable entry point to buy with the aim of growing to the resistance at 150.57. A breakout and consolidation above this range will allow buyers to strengthen their positions in the market, giving them a chance to open long positions with a target at 150.83. The farthest target will be seen at the high of 151.21, where I will fix profits. In case of a decline and lack of bullish activity at 150.21, pressure on the pair will increase. In this case, I will try to enter the market around 149.86. Only with a false breakdown will there be a suitable condition for opening long positions. I plan to buy USD/JPY just after a rebound from 149.55, expecting a correction of 30-35 pips intraday.
Conditions for opening short positions on USD/JPY:
Sellers managed to cope with the tasks and prevented the pair from going beyond yesterday's high. As long as the trade remains below 150.57, we can expect the pair to move downward. In case of growth, I expect bears to show up at this level. A false breakdown there will give a good entry point for selling with a target at the support of 150.21. A breakout and an upward test of this range will deal a more serious blow to bulls' positions, which will open the way to 149.86, which will be a significant success for sellers. A further target will be 149.55, where I will lock in profits. In case of growth and the absence of bears at 150.57, buyers will strengthen their positions. Notably, the development of a new bullish trend is under question. Therefore, it is better to postpone selling until the price tests the next resistance at 150.83. If there is no downward movement, I will sell USD/JPY just after a bounce from 151.21 in anticipation of a 30-35 pips downward correction within the day.
Indicators' signals
Moving averages
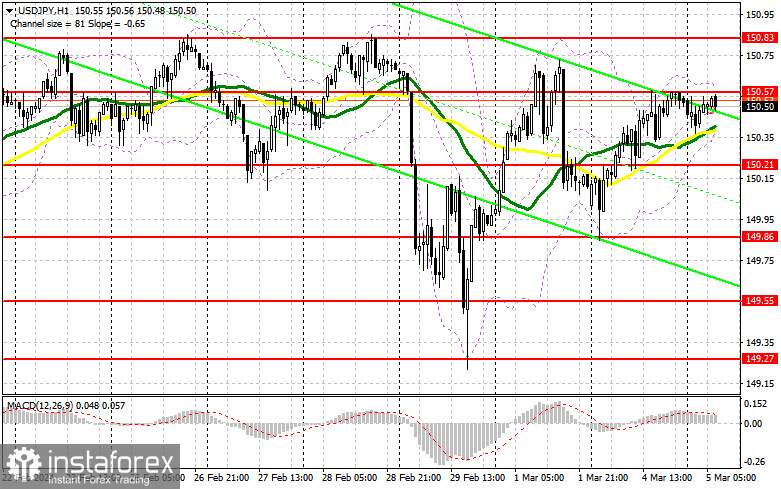
The instrument is trading above the 30 and 50-day moving averages, which points to a rise in the greenback.
Note: The period and prices of the moving averages are considered by the analyst on the 1-hour chart and differ from the general definition of classic daily moving averages on the daily chart.
Bollinger Bands
If the pair declines, the lower limit, located at 150.35, will act as support.
Description of indicators
- Moving average (moving average, determines the current trend by smoothing out volatility and noise). Period 50. It is marked yellow on the chart.
- Moving average (moving average, determines the current trend by smoothing out volatility and noise). Period 30. It is marked green on the chart.
- MACD indicator (Moving Average Convergence/Divergence—convergence/divergence of moving averages) Quick EMA period 12. Slow EMA period to 26. SMA period 9
- Bollinger Bands (Bollinger Bands). Period 20
- Non-commercial speculative traders, such as individual traders, hedge funds, and large institutions that use the futures market for speculative purposes and meet certain requirements.
- Long non-commercial positions represent the total number of long open positions of non-commercial traders.
- Short non-commercial positions represent the total number of short open positions of non-commercial traders.
- Total non-commercial net position is the difference between the short and long positions of non-commercial traders.


