


Analysis of GBP/USD 5M
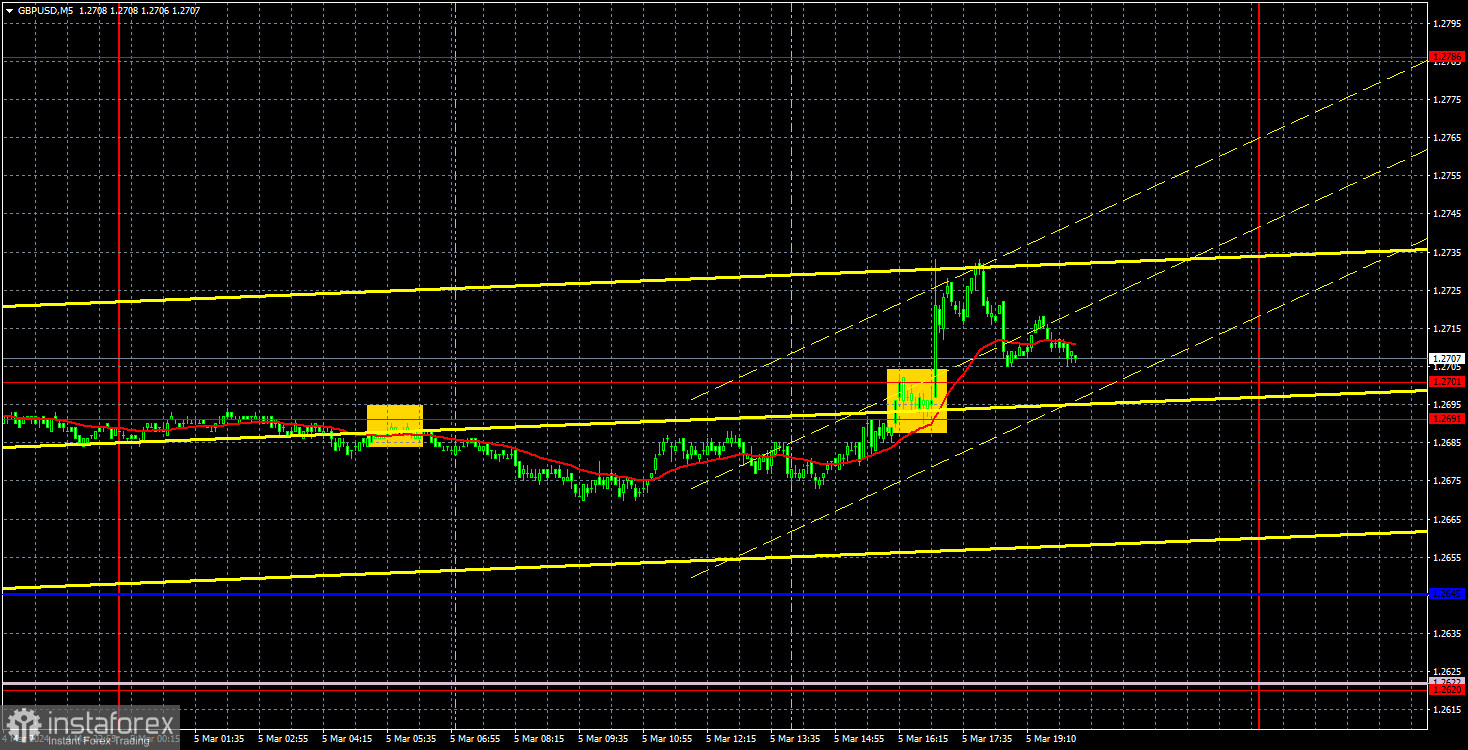
GBP/USD traded higher again on Tuesday. Volatility was low, but at least the pair moved throughout the day. The pound had only one reason to rise. As previously mentioned, during the U.S. trading session, the US ISM Services Purchasing Managers Index (PMI) turned out to be slightly worse than forecasts. This triggered the dollar's decline and the pair breached the 1.2691-1.2701 area, from which the price had bounced at least five times before. Therefore, from a technical perspective, the pound can continue to rise to the level of 1.2786, which serves as the upper boundary of the global sideways channel within which the price has been in for more than three months. The pound has moved out of the small flat, but to leave the global one will require much more effort from the bulls (or bears).
Needless to say, we don't see any reason for the pound to start an upward movement after it failed to correct properly (assuming that the movement of the last 6-7 months is a new upward trend and not a correction against a downward one). The market desperately refuses to sell the pound, even when it has a reason to do so. Therefore, we can only remind you that in the last 3-4 months (if not more), there has been no logic behind the GBP/USD pair's movements. Regardless of the Federal Reserve's sentiment, the dollar cannot rise against the pound.
Yesterday, two trading signals were generated. The first, a sell signal, turned out to be a false signal due to low volatility, and it was practically impossible to set a Stop Loss to breakeven. The second one was formed when the ISM index was published, and it was almost impossible to react to it. Despite the one-sided movement in the last few days, it was still extremely challenging to trade.
COT report:
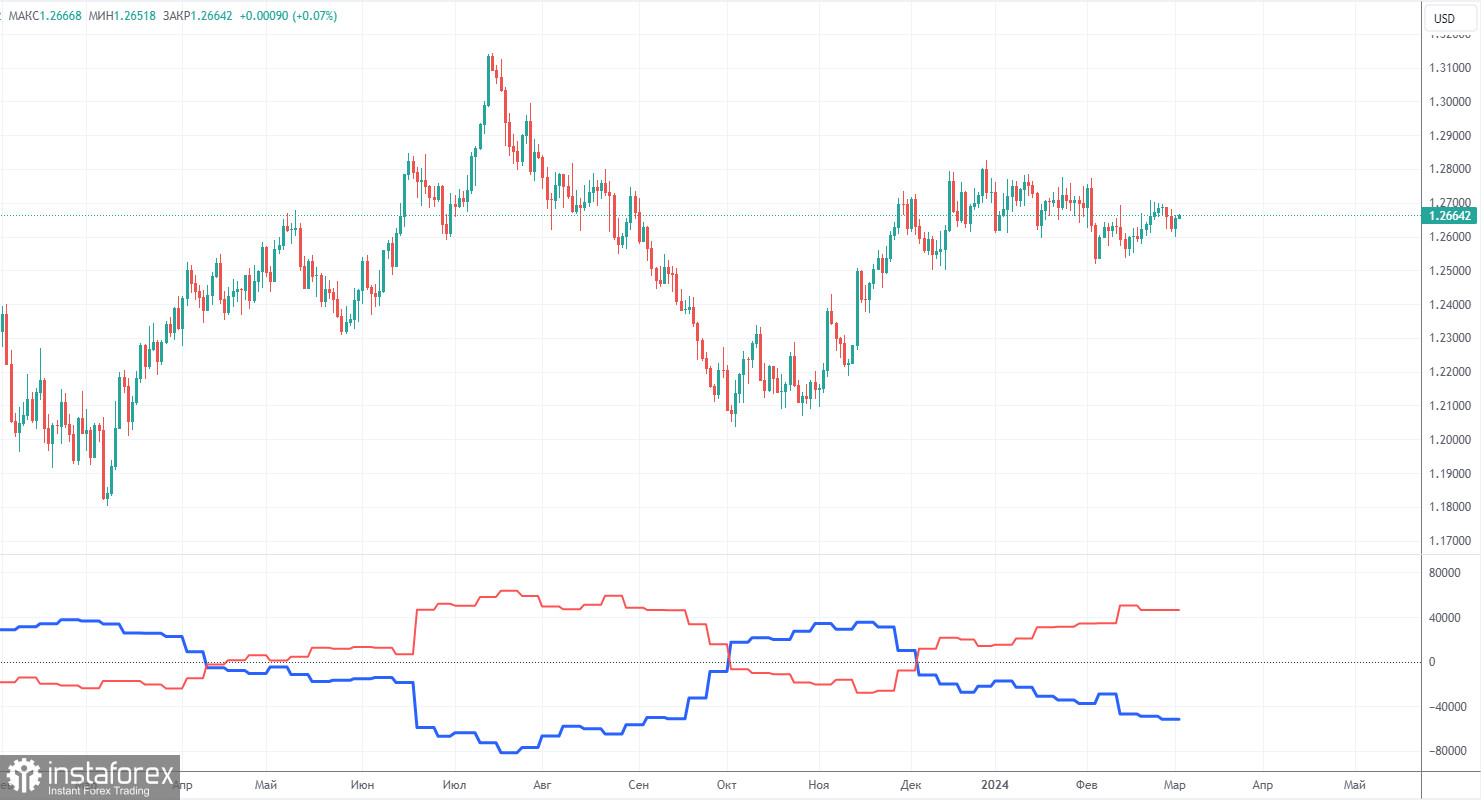
COT reports on the British pound show that the sentiment of commercial traders has frequently changed in recent months. The red and blue lines, which represent the net positions of commercial and non-commercial traders, constantly intersect and, in most cases, remain close to the zero mark. According to the latest report on the British pound, the non-commercial group opened 4,400 buy contracts and 4,300 short ones. As a result, the net position of non-commercial traders increased by 100 contracts in a week. Despite the fact that the net position of speculators is growing, the fundamental background still does not provide a basis for long-term purchases of the pound sterling.
The non-commercial group currently has a total of 92,000 buy contracts and 45,600 sell contracts. The bulls have a big advantage. However, in recent months, we have repeatedly encountered the same situation: the net position either increases or decreases, the bulls or the bears either have the advantage. Since the COT reports do not provide an accurate forecast of the market's behavior at the moment, we have to scrutinize the technical picture and economic reports. The technical analysis suggests that there's a possibility that the pound could show a pronounced downward movement. The economic reports have also been significantly stronger in the United States than in the United Kingdom, but this has not benefited the dollar.
Analysis of GBP/USD 1H
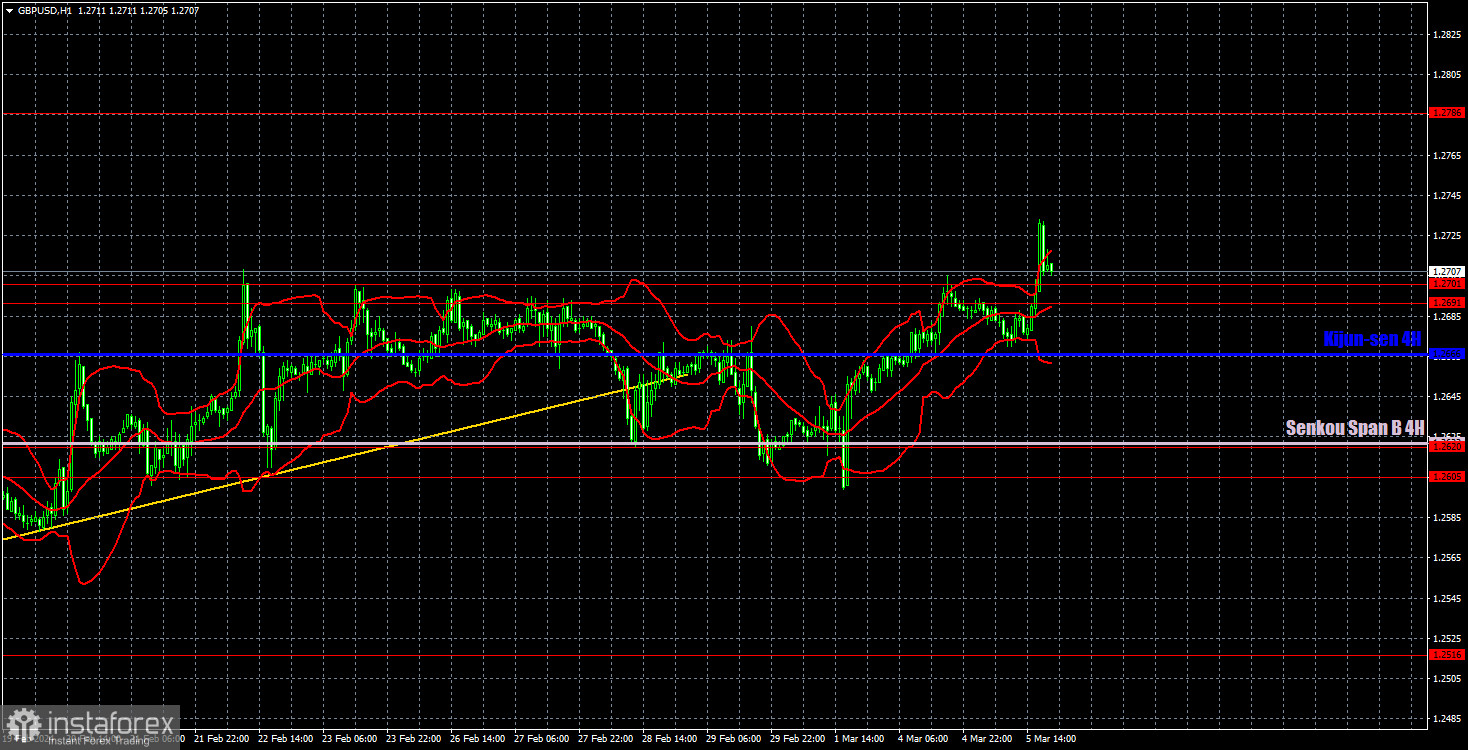
On the 1H chart, GBP/USD left the sideways channel of 1.2611-1.2787 but is now trading within another sideways channel of 1.2605-1.2701. And despite all that, the flat remains intact, and market participants feel quite comfortable in this phase. The British pound is still a currency that tends to move sideways, trading in a somewhat illogical and confusing manner. If this week's U.S. macro data turns out to be even slightly weaker than expected, the pound may rise to the level of 1.2786.
As of March 6, we highlight the following important levels: 1.2215, 1.2269, 1.2349, 1.2429-1.2445, 1.2516, 1.2605-1.2620, 1.2691, 1.2786, 1.2863, 1.2981-1.2987. Senkou Span B (1.2622) and Kijun-sen (1.2666) lines can also serve as sources of signals. Don't forget to set a Stop Loss to breakeven if the price has moved in the intended direction by 20 pips. The Ichimoku indicator lines may move during the day, so this should be taken into account when determining trading signals.
Later on Wednesday, the UK S&P Global Construction PMI will be published. Federal Reserve Chairman Jerome Powell's speech and U.S. reports on ADP and JOLTs will be in the spotlight. The market seems to be looking for any reason to buy the GBP/USD pair rather than sell it.
Description of the chart:
Support and resistance levels are thick red lines near which the trend may end. They do not provide trading signals;
The Kijun-sen and Senkou Span B lines are the lines of the Ichimoku indicator, plotted to the 1H timeframe from the 4H one. They provide trading signals;
Extreme levels are thin red lines from which the price bounced earlier. They provide trading signals;
Yellow lines are trend lines, trend channels, and any other technical patterns;
Indicator 1 on the COT charts is the net position size for each category of traders;
Indicator 2 on the COT charts is the net position size for the Non-commercial group.


