


GBP/USD
Analysis:
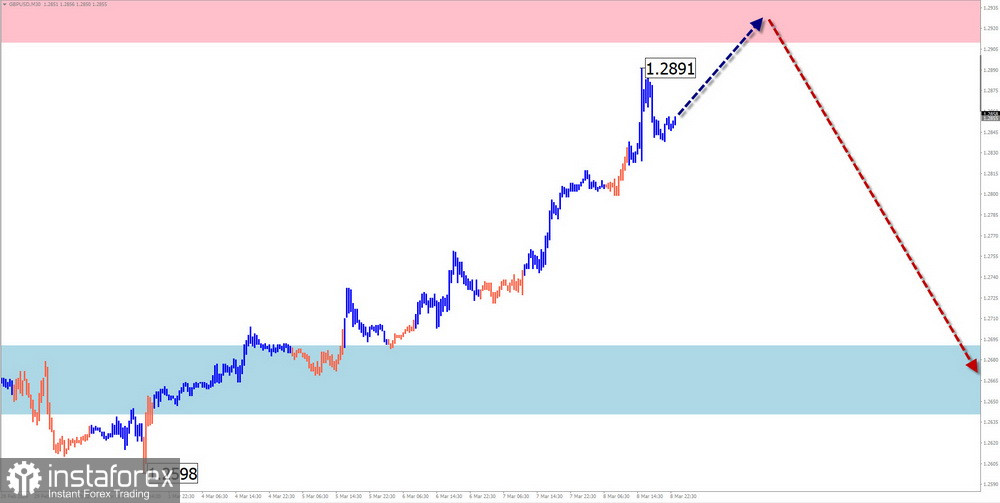
On the chart of the British pound major, a descending wave has been forming since July of the previous year. The analysis of the wave structure indicates the incomplete nature of the middle part of the wave (B), leading from October of the previous year. The price is within the potential reversal zone of the weekly time frame. At the time of analysis, there are no immediate signals of a change in direction on the chart.
Forecast:
In the coming days, a continuation of the bullish sentiment in the British pound's price movement is expected. A sideways flat is possible, exerting pressure on the resistance zone. In the second half of the week, the probability of a change in direction and a decrease in the pair's price to the support zone increases. A temporary breakthrough of the upper boundary of the calculated resistance is not ruled out when the course changes.
Potential Reversal Zones:
Resistance:
- 1.2910/1.2960
Support:
- 1.2690/1.2640
Recommendations:
Buying: The potential for transactions is exhausted; losses are possible.
Selling: This will become relevant after the appearance of confirmed signals in the resistance zone.
AUD/USD
Analysis:
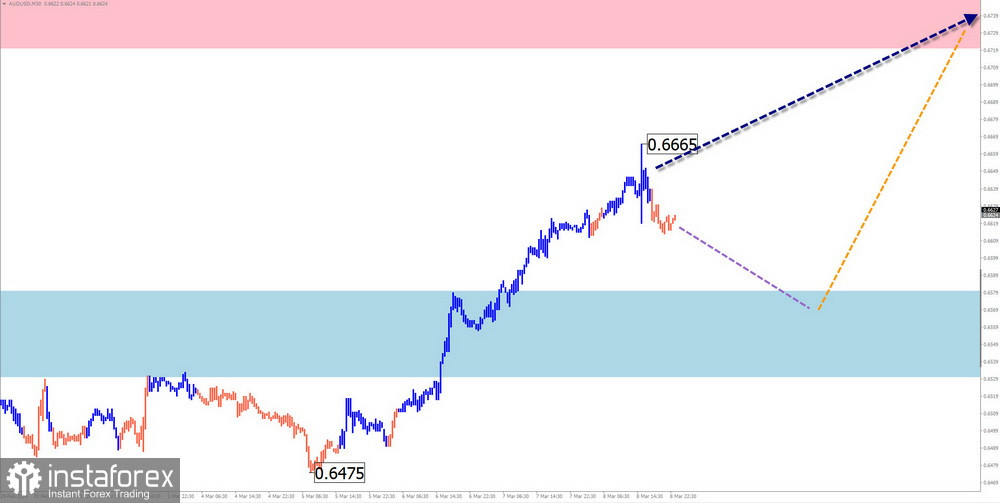
An incomplete bearish wave on the Australian dollar chart has been forming since July of the previous year, creating a descending, shifting flat. Extremums on the chart form a "pennant" shape. The wave structure analysis shows the formation of a corrective rollback within the final part (C). There are no signals of an imminent reversal on the chart.
Forecast:
In the coming days, a continuation of the overall bullish trend of the pair's movement can be expected. A short-term decline towards the calculated support is possible. By the end of the week, the probability of a change in direction and a resumption of the upward price movement increases. Resistance limits the potential for growth.
Potential Reversal Zones:
Resistance:
- 0.6720/0.6770
Support:
- 0.6580/0.6530
Recommendations:
Selling: Transactions are not possible until confirmed reversal signals appear in the calculated resistance zone.
Buying: Have low potential. It's safer to reduce the trading volume and limit the time for transactions within session limits.
USD/CHF
Analysis:
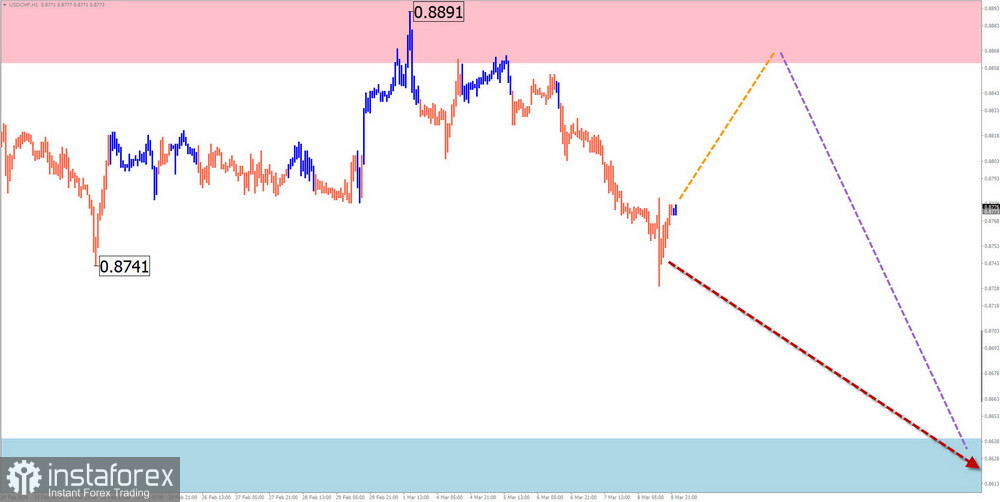
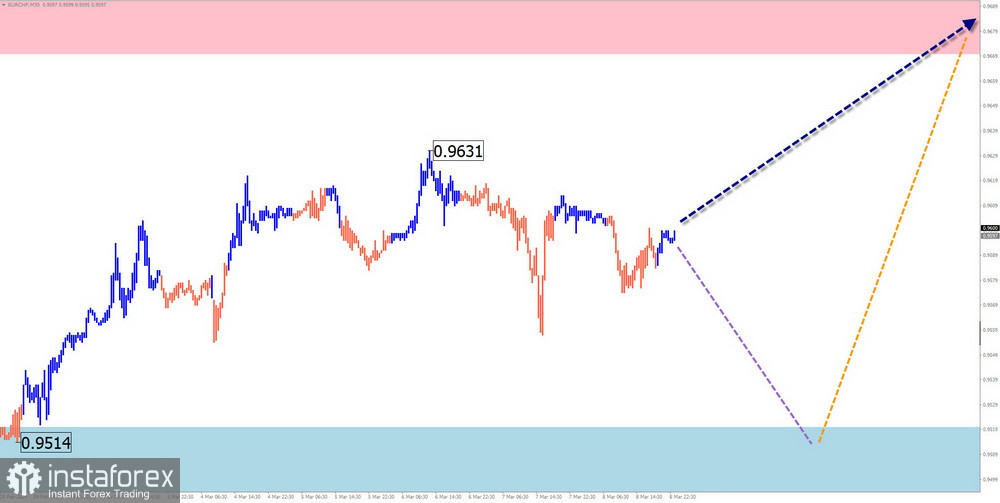
The algorithm of an unfinished bullish wave that has been building since December 28 of the previous year determines the direction of price fluctuations in the short term. Since February 13, quotes in a flat have started forming a descending correction. The price is within the wide potential reversal zone of the weekly time frame.
Forecast:
In the coming days, a continuation of the overall downward trend of the price movement is expected, with a gradual shift of quotes to the calculated support area. At the beginning of the week, a temporary rebound in the resistance area is not excluded.
Potential Reversal Zones:
Resistance:
- 0.9290/0.9340
Support:
- 0.9050/0.9000
Recommendations:
Buying: Can be used with a fractional lot during separate sessions.
Selling: This will become possible after the appearance of confirmed reversal signals in the calculated resistance area.
EUR/JPY
Analysis:
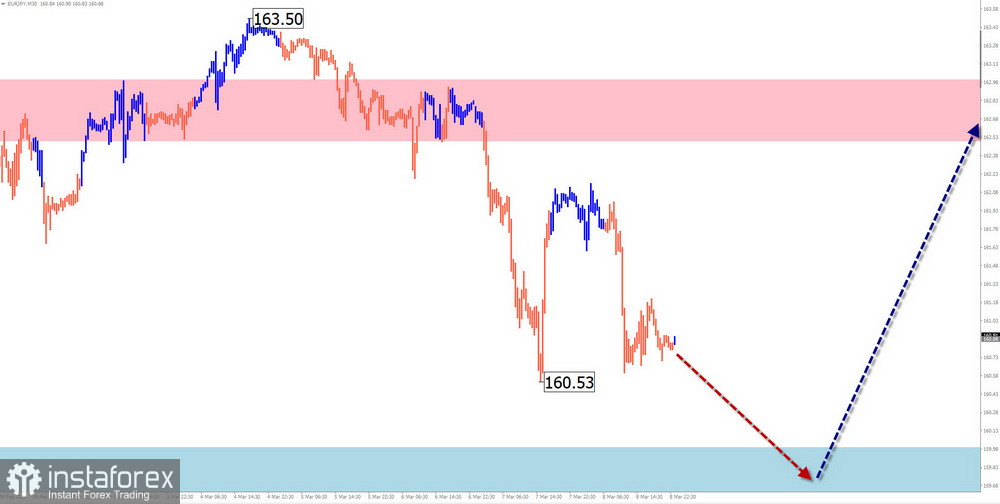
In the market for the euro/yen pair, an ascending trend has been developing since July of the previous year. The unfinished wave segment from February 22 corrects the main wave. The price bounced off the lower boundary of a strong resistance on the weekly time frame.
Forecast:
In the next couple of days, a continuation of the overall descending trend of the price movement of the pair is expected. In the second half of the week, a reversal is expected in the support area, and a resumption of the upward price movement. The rise in the exchange rate can be expected no higher than the resistance zone.
Potential Reversal Zones:
Resistance:
- 162.50/163.00
Support:
- 160.00/159.50
Recommendations:
Buying: Conditions for such transactions will arise after the appearance of reversal signals in the support area.
Selling: Possible during separate sessions with a reduced trading volume. The calculated support limits the potential for transactions.
EUR/CHF
Analysis:
Since September of the previous year, the algorithm of a descending trend has set the direction for short-term fluctuations in the euro/franc pair. The unfinished wave develops in the opposite direction. At present, within the completing part (C), an intermediate rollback down is forming.
Forecast:
In the upcoming week, one should expect a continuation of the overall sideways course of price fluctuations. In the next few days, a descending vector is more likely. Then, in the support area, a reversal and a resumption of the upward price movement towards the resistance zone can be expected.
Potential Reversal Zones:
Resistance:
- 0.9670/0.9720
Support:
- 0.9520/0.9470
Recommendations:
Selling: Possible with a fractional volume during separate trading sessions.
Buying: Can be used in trading after the appearance of confirmed reversal signals in the support area.
US dollar index
Analysis:
Quotes of the US dollar from December of the previous year form an ascending wave. Within its structure, a corrective extension has been developing since the beginning of February, in the form of a stretched flat. At present, the final section is forming. The calculated support runs along the upper boundary of the strong potential reversal zone of the daily time frame.
Forecast:
In the next few days, a gradual decrease in the quotes of the dollar index to the calculated support area is expected. At the beginning of the week, a short-term pressure on the resistance cannot be ruled out. The support zone demonstrates the most likely segment of the weekly decline in the instrument.
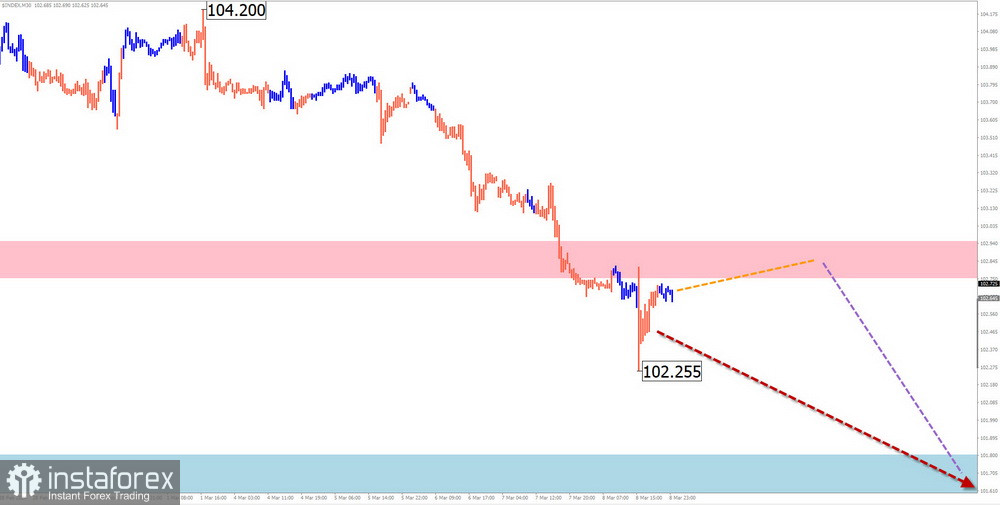
Potential Reversal Zones:
Resistance:
- 102.75/102.95
Support:
- 101.80/101.60
Recommendations:
Buying: Should not expect a strengthening of the US dollar in the coming days.
Selling: Transactions will become possible in major pairs to strengthen positions in national currencies after the appearance of corresponding signals from trading systems in the calculated resistance area.
Explanation: In simplified wave analysis (SWA), all waves consist of 3 parts (A-B-C). The latest, unfinished wave is analyzed at each time frame. Dashed lines indicate expected movements.
Note: The wave algorithm does not take into account the duration of instrument movements in time!


