


EUR/USD
Higher Timeframes
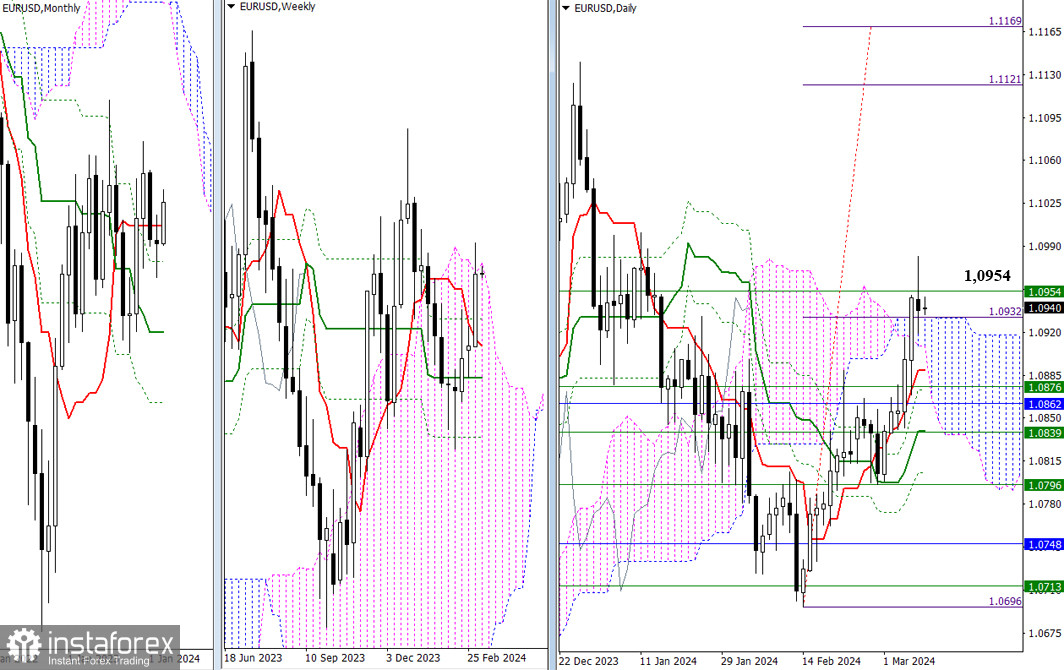
The week started almost from the same positions where the previous workweek ended. The market is not in a hurry to show activity, so the previously voiced conclusions and expectations retain their significance. For the bulls, it is now important not only to maintain the achieved levels but also to break free from the Ichimoku cloud, firmly consolidating in the bullish zone relative to the daily (1.0932) and weekly (1.0954) clouds. They can then focus on continuing the ascent, with the high (1.1140) and the daily target (1.1121 – 1.1169) serving as benchmarks.
Loss of altitude and bearish activity will contribute to a return to previously passed levels. In the current conditions, in case of a decline, the nearest supports may be 1.0909 (lower boundary of the daily cloud) – 1.0889 (daily Tenkan) – 1.0876 (weekly Fibonacci Kijun).
H4 – H1
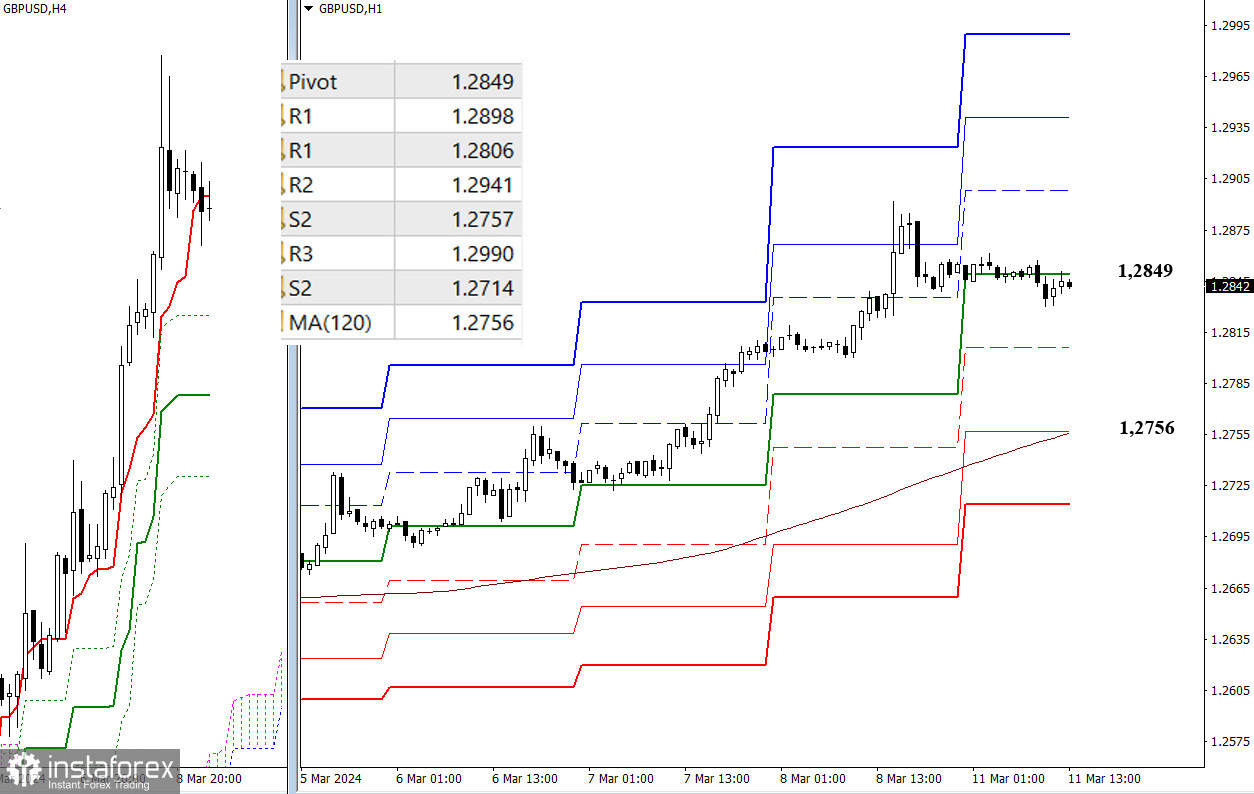
On the lower timeframes, the pair is in a correction zone. The market has lost the support of the central pivot point of the day (1.0946) but continues to consolidate below the level, unable to overcome its attraction. Restoring positions and continuing the ascent will focus the bulls' attention on overcoming the resistances of the classic pivot points; today, they are located at 1.0974 – 1.1009 – 1.1037. The development of the correction, in turn, will lead to testing the weekly long-term trend, currently at 1.0897. A breakthrough and consolidation below the trend will affect the current balance of power; further strengthening of bearish sentiments during the day may pass through breaking the supports of classic pivot points (1.0883 – 1.0848).
***
GBP/USD
Higher Timeframes
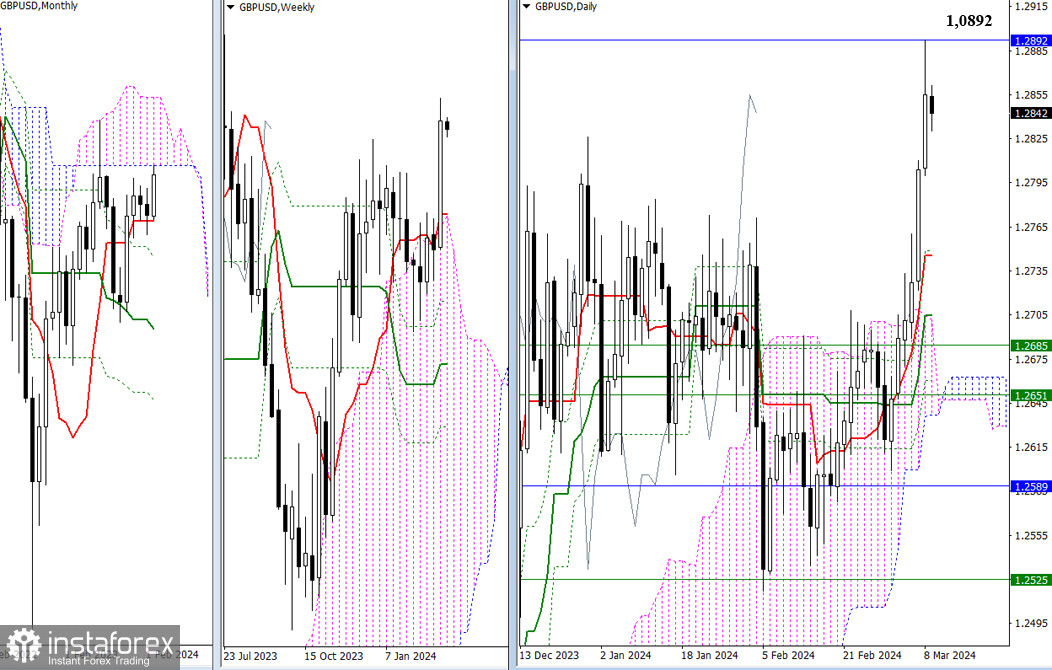
Last week, the pound reached the lower boundary of the monthly cloud (1.2892). The new week will shape the result of the interaction. Senkou Span B is the strongest level of the monthly timeframe, so the outcome of the testing may determine the development of the situation for a relatively long period. The current supports are the levels of the daily Ichimoku cross (1.2746 – 1.2704), but due to their distance from the price chart, they are unlikely to be relevant.
H4 – H1
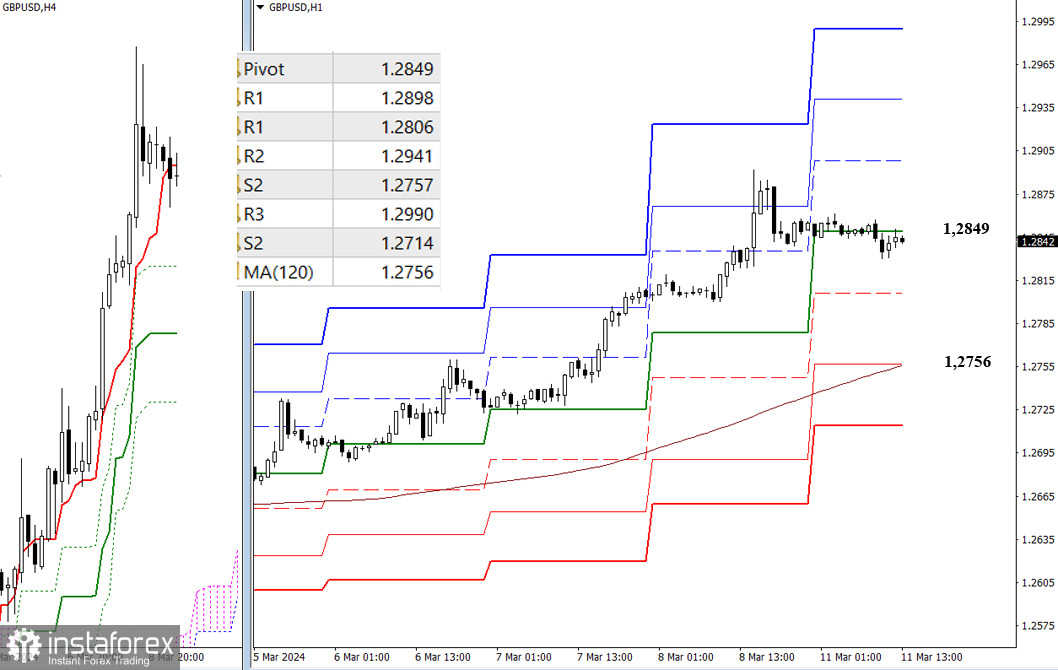
On the lower timeframes, a corrective decline is developing. The size of the correction at this chart segment can be deep enough since the key level responsible for the current balance of power is located at a sufficient distance from the price chart, currently at the level of 1.2756 (weekly long-term trend). S1 (1.2806) may provide intermediate support on this path. If bullish activity returns, the benchmarks for the intraday ascent today will be the resistances of the classic pivot points (1.2898 – 1.2991 – 1.2990).
***
The technical analysis of the situation uses:
Higher timeframes - Ichimoku Kinko Hyo (9.26.52) + Fibonacci Kijun levels
Lower timeframes - H1 - Pivot Points (classic) + Moving Average 120 (weekly long-term trend)


