


At the beginning of the new week, dollar buyers and investors are hesitant to take active actions in anticipation of tomorrow's publication of fresh inflation data in the United States.
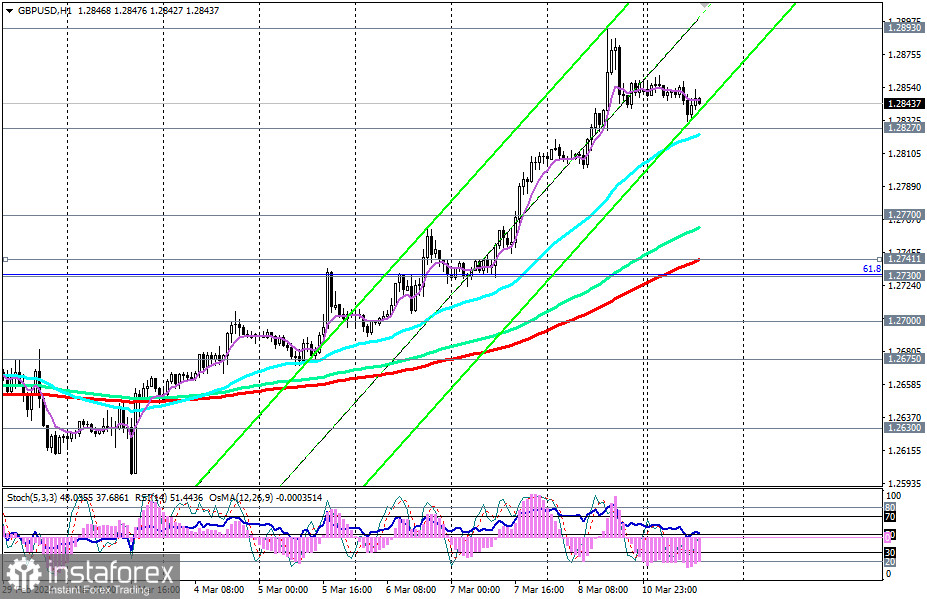
Most dollar currency pairs are trading in the first half of today's trading day within ranges, while the GBP/USD pair is near the 1.2845 mark, approximately in the middle of the range between today's high of 1.2862 and the low of 1.2832.
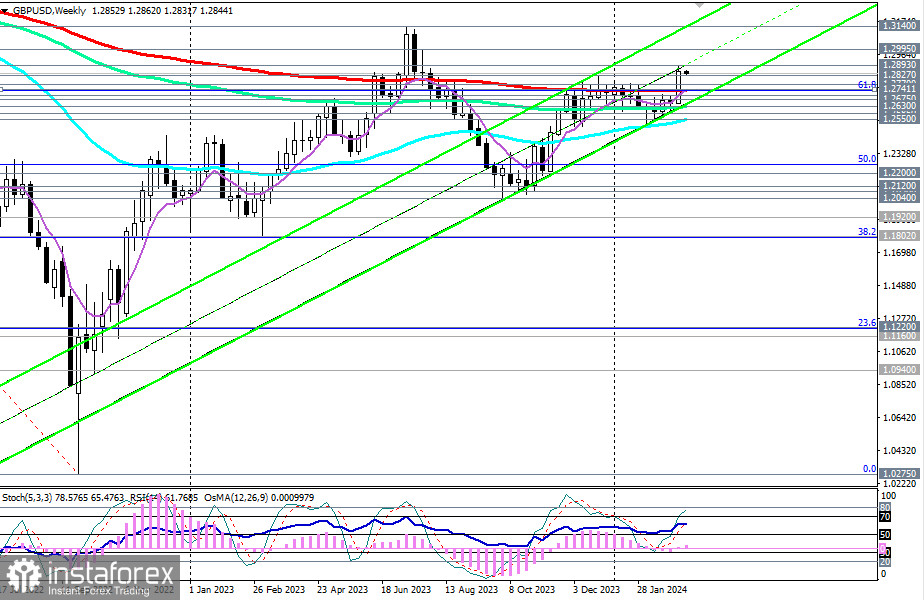
At the same time, GBP/USD maintains a positive dynamic and attempts to develop an upward correction amid the dollar's weakness in the area of the long-term bullish market, above the key support level of 1.2730 (200 EMA on the weekly chart).
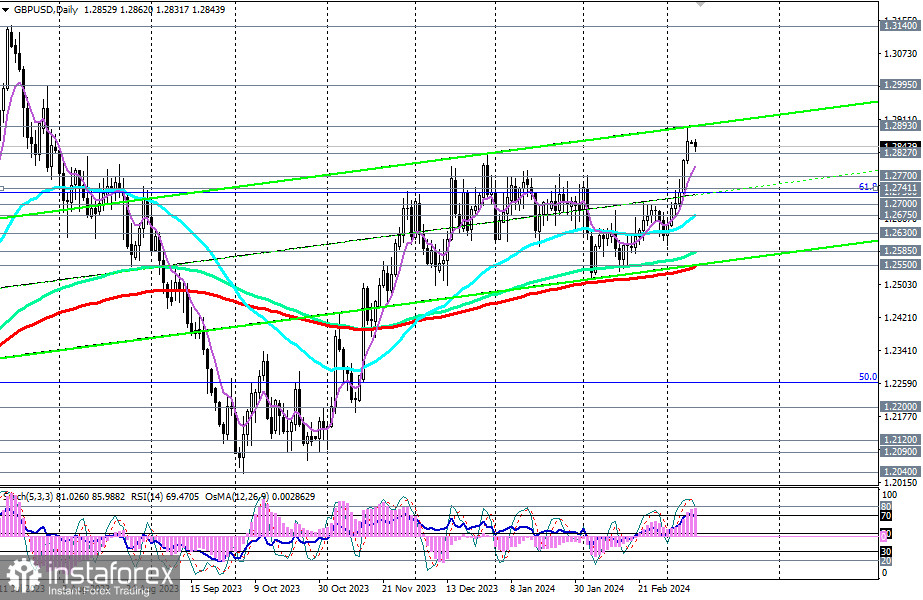
Technical indicators RSI, OsMA, and Stochastic on daily and weekly charts are also in favor of buyers.
In the event of new fundamental drivers appearing on Tuesday, GBP/USD may continue to rise. In this case, a breakout of today's high of 1.2862 can be the first signal for the development of a scenario for growth, with the breakout of last week's high and the level of 1.2893 confirming it.
In this case, the nearest medium-term targets will be the levels of 1.3100, 1.3140, near which the upper line of the upward channel on the weekly chart passes.
In an alternative scenario, a breakthrough of the local support level 1.2827 may trigger a decline in GBP/USD, with the target at the key support level of 1.2730. Its breakthrough will return the price to the area of the long-term bearish market with intermediate decline targets at support levels 1.2700, 1.2675, 1.2630. Further decline and a breakthrough of key support levels 1.2550 (200 EMA on the daily chart) and 1.2500 will bring GBP/USD into the zone of the medium-term bearish market, making short positions a priori preferable.
Tomorrow's publications (at 07:00 and 12:30 GMT) may become new drivers in the dynamics of GBP/USD.
Support levels: 1.2827, 1.2800, 1.2770, 1.2741, 1.2730, 1.2700, 1.2675, 1.2630, 1.2600, 1.2585, 1.2550, 1.2500
Resistance levels: 1.2860, 1.2890, 1.2900, 1.3000, 1.3100, 1.3140
Trading Scenarios
Main scenario: Sell Stop 1.2820. Stop-Loss 1.2870. Targets 1.2800, 1.2770, 1.2741, 1.2730, 1.2700, 1.2675, 1.2630, 1.2600, 1.2585, 1.2550, 1.2500
Alternative scenario: Buy Stop 1.2870. Stop-Loss 1.2820. Targets 1.2890, 1.2900, 1.3000, 1.3100, 1.3140
"Targets" correspond to support/resistance levels. This also does not mean that they will necessarily be reached, but they can serve as a guide in planning and placing your trading positions.


