


Trend analysis (Fig. 1).
The EUR/USD currency pair may move downward from the level of 1.0872 (closing of yesterday's daily candle) to test the 38.2% pullback level at 1.0864 (red dotted line). After that, an upward movement is possible to the 1.0902 resistance level (white thick line).
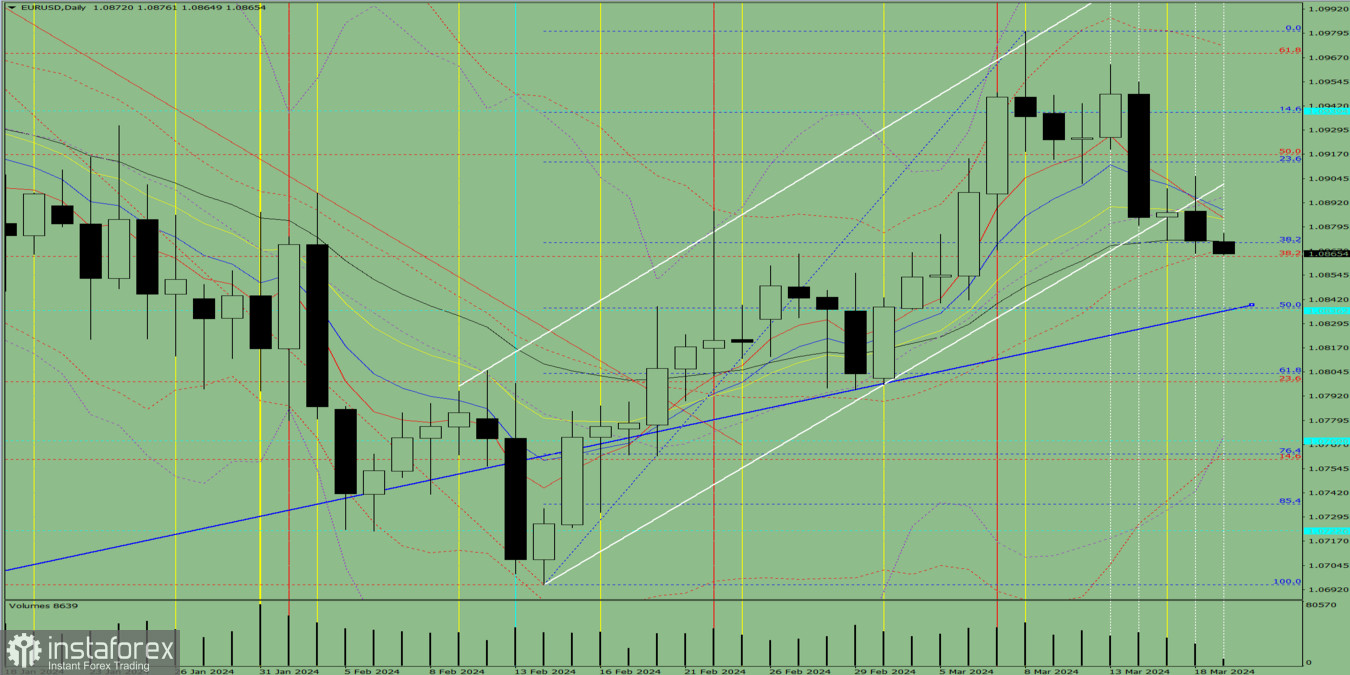
Fig. 1 (daily chart).
Comprehensive analysis:
- Indicator analysis – down;
- Volumes – down;
- Candlestick analysis – down;
- Trend analysis – down;
- Bollinger bands – down;
- Weekly chart – up.
General conclusion: Today, the price may move downward from the level of 1.0872 (closing of yesterday's daily candle) to test the 38.2% pullback level at 1.0864 (red dotted line). After that, an upward movement is possible to the 1.0902 resistance level (white thick line).
Alternatively, from the level of 1.0872 (closing yesterday's daily candle), the price may move downward to test the 50% pullback level at 1.0837 (blue dotted line). After that, an upward movement is possible to the 38.2% pullback level at 1.0864 (red dotted line).


