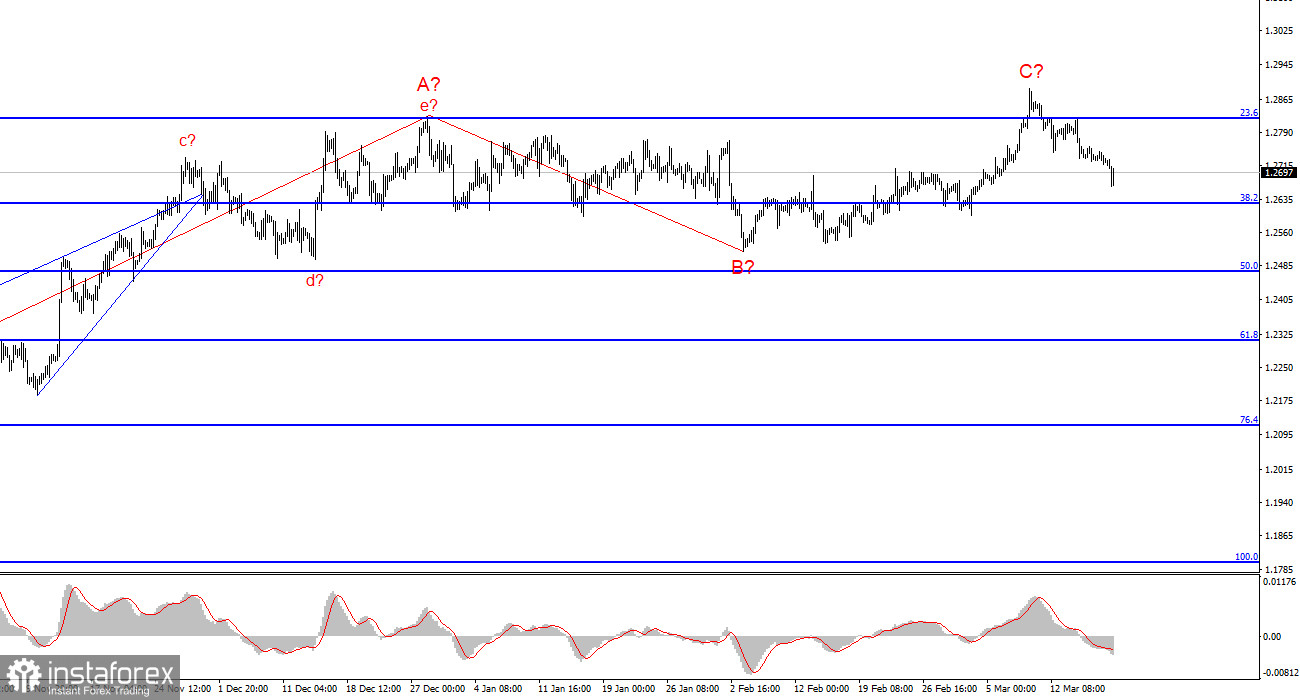
The wave analysis for the GBP/USD pair remains fairly understandable and at the same time remains complex. The construction of a new downtrend section continues, the first wave of which has taken on a quite extensive form. The second wave also turned out to be quite extensive, which gives us every reason to expect the prolonged construction of the third wave.
At the moment, I have no confidence that the construction of wave 2 or b is complete. Wave 2 or b has already taken on a three-wave appearance but has become complex again. Theoretically, wave 2 or b may extend to 100% of wave 1 or a. The unsuccessful attempt to break through the level of 1.2876, which corresponds to 76.4% according to Fibonacci, may indicate the long-awaited completion of the upward wave.
Targets for lowering the pair within the presumed wave 3 or c are located below the level of 1.2039, which corresponds to the low of wave 1 or a. Unfortunately, the wave analysis tends to become more complex and does not correspond to the news background. At the moment, I do not reject the working scenario, but the market still does not see motives for long-term sales of the pair.
Bulls may continue to retreat from the market in the coming weeks.
The GBP/USD pair rate dropped by 30 basis points on Tuesday. Just an hour ago, data on issued building permits and the number of housing starts in America were released. Both reports turned out to be more positive than the market expected. However, these data were not the reason for the decline of the pound and the rise of the dollar.
It should be noted that demand for the pound has been declining for a week and a half. It is decreasing slowly and not rapidly. At least, I still cannot conclude that the trend has turned bearish, and we will finally see an impulsive wave 3 or c. But at the same time, the pair is still declining against the backdrop of tightening expectations for the Fed rate. This week, the UK will release an inflation report, and the Bank of England will hold a meeting. But these events remain in the shadow for now, as the Bank of England is unlikely to change the tone of its statements, and inflation remains too high to expect statements from the regulator about easing monetary policy.
Based on all of the above, I believe that the market may shift towards buying the dollar. Moreover, the regularity of such action is indicated by many more factors than the complication of the upward wave 2 or b and the new rise of the pound. I continue to expect a decrease in the pair. The nearest breakout level is 1.2628.
General Conclusions.
The wave pattern of the GBP/USD pair still suggests a decline. At the moment, I still consider selling the pair with targets below the level of 1.2039, as I believe that wave 3 or c will sooner or later begin. However, until wave 2 or b is complete (with a hundred percent probability), an increase in the pair can be expected up to the level of 1.3140, which corresponds to 100.0% according to Fibonacci. The construction of wave 3 or c may have already started, but the retreat of quotes from the reached peaks is still too small to be confident in such a conclusion. The breakthrough of the level of 1.2715 adds confidence to the bearish scenario.
On a larger wave scale, the picture is similar to the EUR/USD pair, but there are still some differences. The descending corrective section of the trend continues to be built, and its second wave has taken on an extensive form - 61.8% of the first wave. An unsuccessful attempt to break through this level may lead to the start of building wave 3 or c.
The main principles of my analysis:
- Wave structures should be simple and understandable. Complex structures are difficult to play, they often bring changes.
- If there is no confidence in what is happening in the market, it is better not to enter it.
- There is never one hundred percent certainty about the direction of movement. Don't forget about protective Stop Loss orders.
- Wave analysis can be combined with other types of analysis and trading strategies.


