


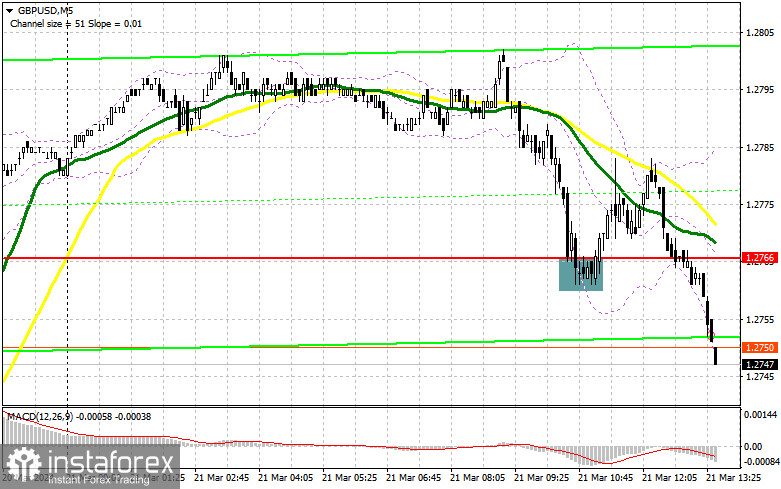
In my morning forecast, I highlighted the level of 1.0920 and planned to make decisions on market entry based on it. Let's look at the 5-minute chart and figure out what happened there. The breakout of 1.0920 occurred, but there was no retest, preventing finding suitable market entry points during the first half of the day. For this reason, the technical picture was reassessed for the second half of the day.
For opening long positions on EUR/USD, the following is required:
Weak data on manufacturing activity, especially in Germany, led to a decline in the euro and the reversal of half of the growth that bulls achieved after the Federal Reserve meeting yesterday. In the second half of the day, we expect similar data, but already on activity in the US, where indicators promise to be much better than in the eurozone. An increase in the PMI index for the manufacturing sector, the PMI index for the services sector, and the composite PMI index for the US will lead to a decline in EUR/USD, so buying should be cautiously approached. Data on initial jobless claims and existing home sales will also be released. In case of a decline in the pair, I plan to act around the new support area at 1.0889, formed by the results of the first half of the day. A false breakout will be a suitable option for buying with the expectation of a surge toward 1.0942 resistance, also formed during the European session. A breakthrough and downward retest of this range against weak US statistics will strengthen the pair with a chance of a surge to 1.0980. The ultimate target will be a maximum of 1.0998, where I will take profit. In case of further decline in EUR/USD and lack of activity around 1.0889 in the second half of the day, where the moving averages are also located, the pressure on the euro will only increase, leading to further decline with the prospect of testing 1.0839. I plan to enter the market there only after a false breakout. I plan to open long positions immediately on a rebound from 1.0800 with a target of a 30-35 point upward correction within the day.
For opening short positions on EUR/USD, the following is required:
Sellers haven't disappeared; taking advantage of poor statistics, they played a part in yesterday's growth. In case of a pair's rise, the focus will shift to protecting the nearest resistance at 1.0942, where a false breakout will provide a good entry point for short positions with the prospect of testing the new support at 1.0889. A breakout and consolidation below this range against the backdrop of a strong US labor market and PMI indices, as well as a bottom-up retest, will provide another selling opportunity with a plunge of the pair towards 1.0839, where buyers will become more active. The ultimate target will be a minimum of 1.0800, where I will take profit. If EUR/USD moves up in the second half of the day and there are no bears at 1.0942, buyers will have a chance for further growth in continuation of yesterday's bullish market. In this case, I will postpone selling until testing the next resistance at 1.0980. I will also sell there, but only after an unsuccessful consolidation. I plan to open short positions immediately on a rebound from 1.0998 with a 30-35 point downward correction target.
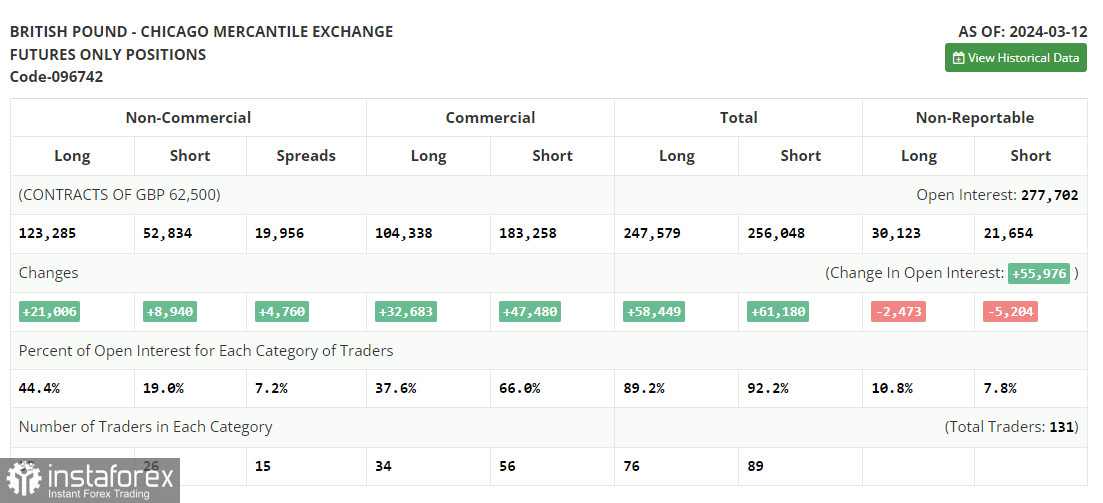
In the COT report (Commitment of Traders) for March 12, there was a reduction in both long and short positions. The results of the European Central Bank meeting continued to put pressure on risky assets, as traders received no specifics. US inflation data further convinced market participants that it is still too early to think about rate cuts by the Federal Reserve. For this reason, I am betting on further development of the bullish trend for the US dollar and a decline in the euro. The COT report indicates that non-commercial long positions fell by 6,027 to 193,998, while short non-commercial positions decreased by 14,123 to 119,591. As a result, the spread between long and short positions increased by 16,555.
Indicator Signals:
Moving Averages
Trading is conducted above the 30 and 50-day moving averages, indicating further pair growth.
Note. The author considers the period and prices of moving averages on the hourly chart H1, and they differ from the general definition of classical daily moving averages on the daily chart D1.
Bollinger Bands
In case of a decline, the lower boundary of the indicator will act as support around 1.0889.
Indicator Descriptions:
- Moving Average (determines the current trend by smoothing volatility and noise). Period - 50. Marked in yellow on the chart;
- Moving Average (determines the current trend by smoothing volatility and noise). Period - 30. Marked in green on the chart;
- MACD Indicator (Moving Average Convergence/Divergence). Fast EMA - period 12. Slow EMA - period 26. SMA - period 9;
- Bollinger Bands. Period - 20;
- Non-commercial traders - speculators, such as individual traders, hedge funds, and large institutions using the futures market for speculative purposes and meeting certain requirements;
- Long non-commercial positions represent the total long open position of non-commercial traders;
- Short non-commercial positions represent the total short open position of non-commercial traders;
- The total non-commercial net position is the difference between non-commercial traders' short and long positions.


