


Trend analysis (Fig. 1).
The GBP/USD currency pair may move downward from the level of 1.2654 (closing of yesterday's daily candle) to 1.2611, the historical support level (blue dotted line). In the case of testing this level, an upward movement is possible with a target of 1.2661, the 61.8% pullback level (yellow dotted line).
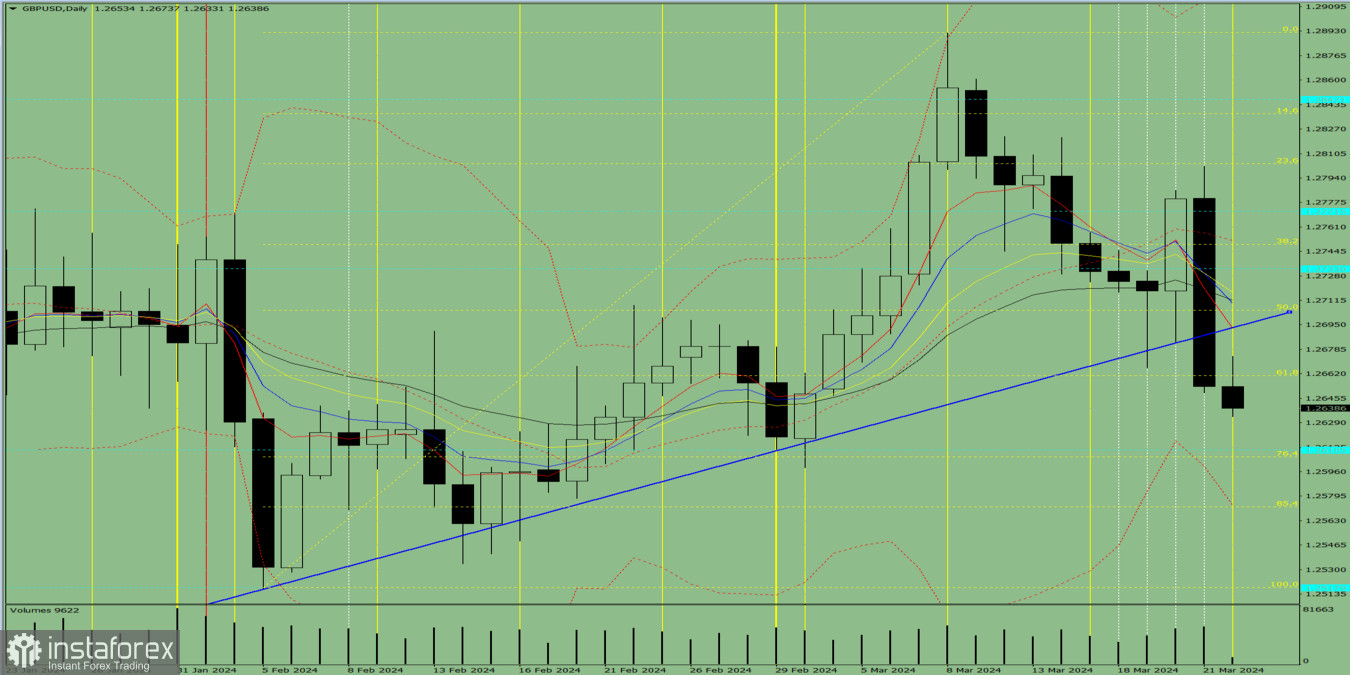
Fig. 1 (daily chart).
Comprehensive analysis:
- Indicator analysis – down;
- Fibonacci levels – down;
- Volumes – down;
- Candlestick analysis – up;
- Trend analysis – down;
- Bollinger bands – down;
- Weekly chart – down.
General conclusion: Today, the price may move downward from the level of 1.2654 (closing of yesterday's daily candle) to 1.2611, the historical support level (blue dotted line). In the case of testing this level, an upward movement is possible with a target of 1.2661, the 61.8% pullback level (yellow dotted line).
Alternatively, from the level of 1.2654 (closing of yesterday's daily candle), the price may move downward to 1.2633 and then continue to move upward with a target of 1.2661, the 61.8% pullback level (yellow dotted line).


