


Trend analysis (Fig. 1).
The EUR/USD currency pair may move upward from the level of 1.0835 (closing of yesterday's daily candle) to test the 38.2% pullback level at 1.0864 (red dotted line). After that, a continued upward movement is possible to the 38.2% pullback level at 1.0870 (yellow dotted line).
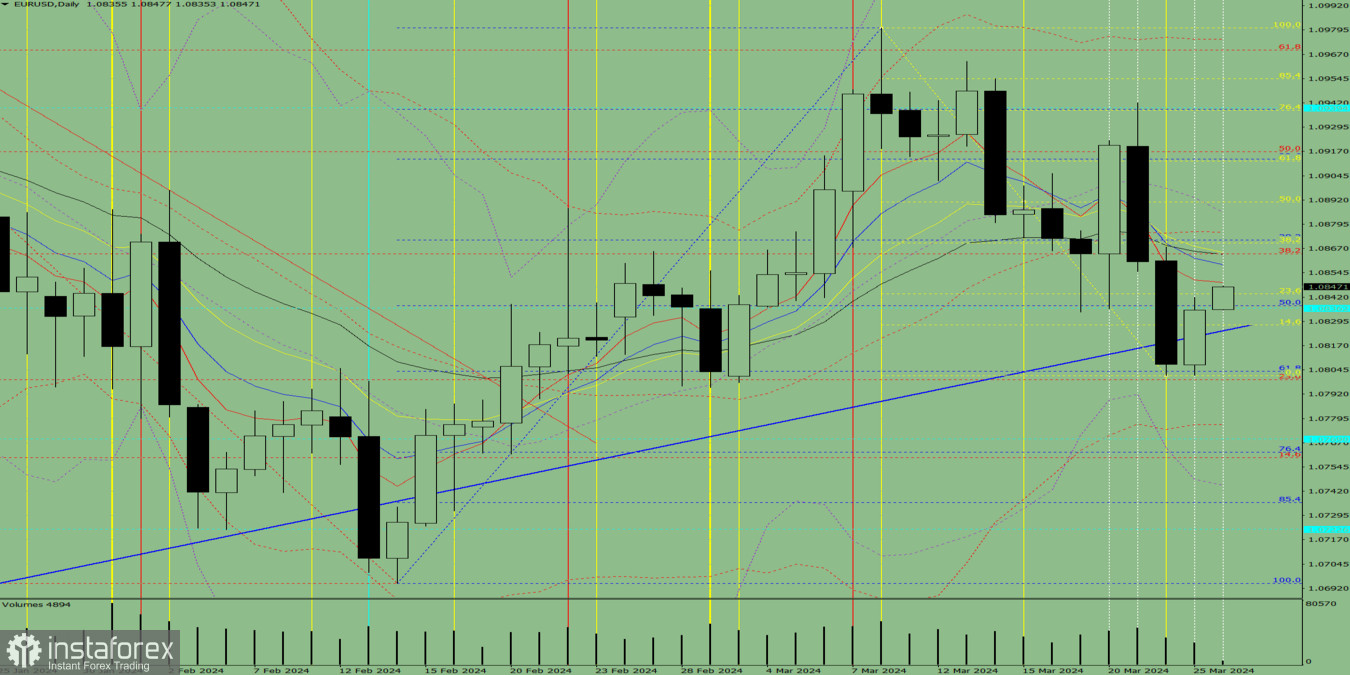
Fig. 1 (daily chart).
Comprehensive analysis:
- Indicator analysis – up;
- Volumes – up;
- Candlestick analysis – up;
- Trend analysis – up;
- Bollinger bands – down;
- Weekly chart – up.
General conclusion: Today, the price may move upward from the level of 1.0835 (closing of yesterday's daily candle) to test the 38.2% pullback level at 1.0864 (red dotted line). After that, a continued upward movement is possible to the 38.2% pullback level at 1.0870 (yellow dotted line).
Alternatively, from the level of 1.0835 (closing of yesterday's daily candle), the price may move upward to test the 38.2% pullback level at 1.0864 (red dotted line). After that, a downward movement is possible to the 23.6% pullback level at 1.0844 (yellow dotted line).


