


EUR/USD
Analysis:
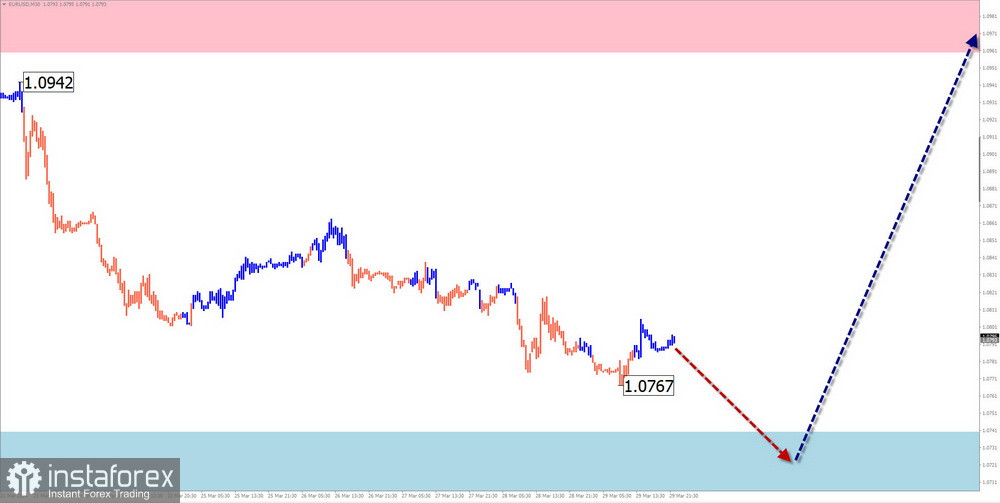
In the short term, the price of the EUR/USD pair follows the algorithm of the latest, yet unfinished, downward wave since July 14th of the previous year. Over the past four months, the price has formed a correction in the shape of a shifting plane. By now, the wave structure is nearing completion. Throughout the current month, the price has been moving sideways.
Forecast:
In the upcoming week, we can anticipate the conclusion of the downward trend of the euro, possibly reaching the calculated support levels. A reversal and resumption of the price rise are expected in the latter half of the week. The calculated resistance represents the upper boundary of the pair's weekly range.
Potential Reversal Zones
Resistance:
- 1.0960/1.1010
Support:
- 1.0740/1.0690
Recommendations:
Selling: fractional volumes may be used within intraday trading.
Buying: such transactions are premature until confirmed reversal signals appear around the calculated support zone.
USD/JPY
Analysis:
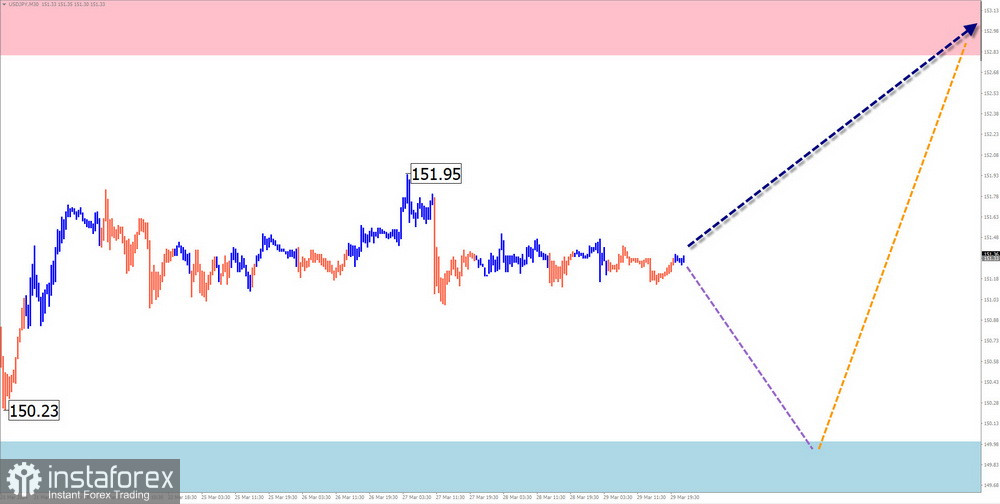
The bullish wave, initiated in July of the previous year, sets the main direction for the price fluctuations of the Japanese yen. The final part (C) commenced on March 8th. The price retraced downward within a predominantly sideways movement throughout the past week.
Forecast:
The sideways movement is expected to continue in the next couple of days. A brief price decline may occur within the calculated support levels. Towards the end of the week, increased volatility, reversals, and resumptions of the price uptrend can be anticipated.
Potential Reversal Zones
Resistance:
- 152.80/153.20
Support:
- 150.00/149.50
Recommendations:
Selling: risky, with low potential. Volume sizes should be reduced.
Buying: may be utilized in trading after confirmed reversal signals appear around the support zone.
GBP/JPY
Analysis:
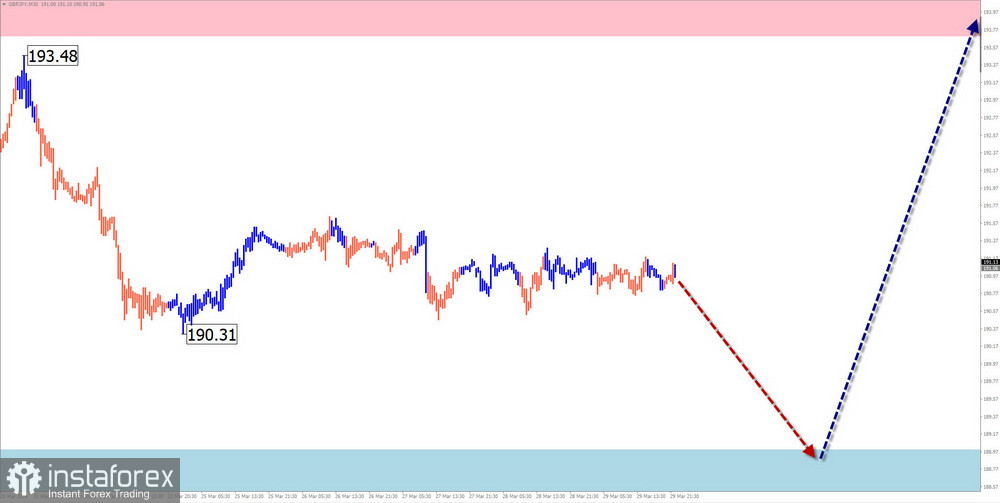
Since the end of December of the previous year, the direction of the GBP/JPY cross has been set by an ascending wave. Analysis of the structure indicates the formation of the middle corrective part (B) over the last two months. Last week, quotes drifted, foreshadowing significant price shifts.
Forecast:
The sideways movement is expected to continue in the next couple of days. A short-term decline, possibly reaching the support zone, is not ruled out in the early days. By the end of the week, a change in direction and resumption of the price uptrend can be expected. The resistance zone will limit the upward movement.
Potential Reversal Zones
Resistance:
- 193.70/194.20
Support:
- 189.00/188.50
Recommendations:
Selling: risky. Volume sizes should be reduced.
Buying: premature until confirmed reversal signals from your trading systems appear around the support zone.
USD/CAD
Analysis:
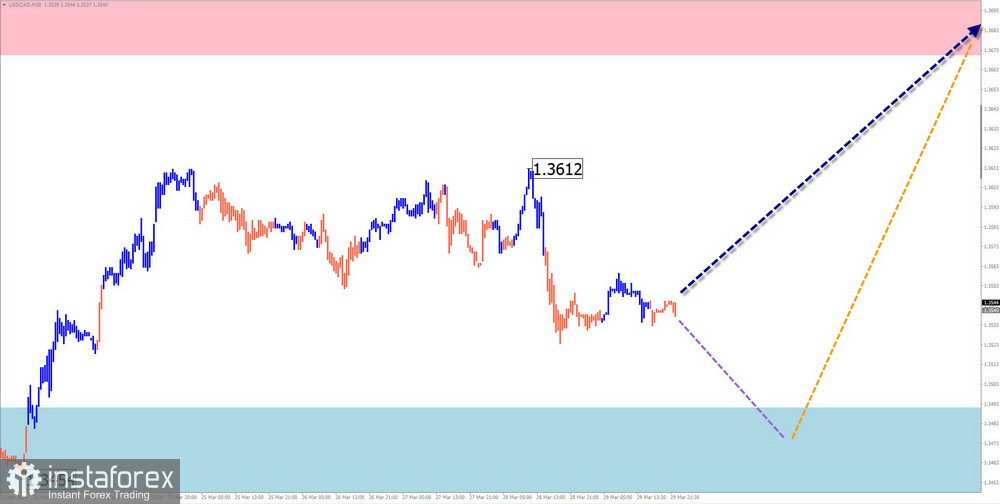
The current wave structure of the major Canadian dollar pair has been upward since the end of December of the previous year. Analysis of the structure indicates the formation of the middle part of the wave (B). The upward wave that started on March 21st possesses reversal potential.
Forecast:
Throughout the coming week, a continuation of the overall sideways price movement of the pair is expected. A downward trend is more likely in the first half. Towards the end of the week, a change in direction and resumption of the price uptrend can be anticipated.
Potential Reversal Zones
Resistance:
- 1.3670/1.3720
Support:
- 1.3490/1.3440
Recommendations:
Selling: possible with reduced volume sizes within individual sessions. The support zone limits the potential.
Buying: will become relevant after confirmed reversal signals appear around the support zone.
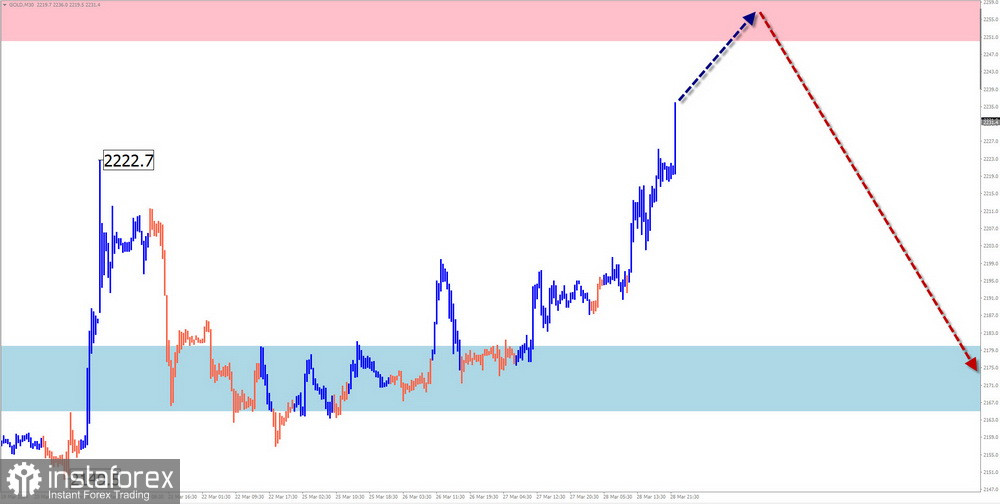
Gold
Analysis:
In the short term, the direction of gold movement has been upward since October of the previous year. On a larger scale, this segment marks the end of the dominant trend. Quotes have reached a historical maximum, closely approaching the upper boundary of a potent reversal zone on the weekly chart.
Forecast:
The overall upward movement of the instrument is expected to continue next week. The conclusion of the price rise is likely around the calculated resistance. Subsequently, a change in direction and a beginning of decline, possibly towards the support zone, can be expected. Increased activity is anticipated closer to the weekend.
Potential Reversal Zones
Resistance:
- 2250.0/2265.0
Support:
- 2180.0/2165.0
Recommendations:
Buying: possible with reduced volume sizes. The potential is limited by resistance.
Selling: premature until confirmed reversal signals from your trading systems appear.
Explanation: In simplified wave analysis (SWA), all waves consist of 3 parts (A-B-C). The latest, unfinished wave is analyzed on each timeframe. Dotted lines represent expected movements.
Attention: The wave algorithm does not consider the duration of instrument movements in time!


