


Analyzing Friday's trades:
GBP/USD on 1H chart
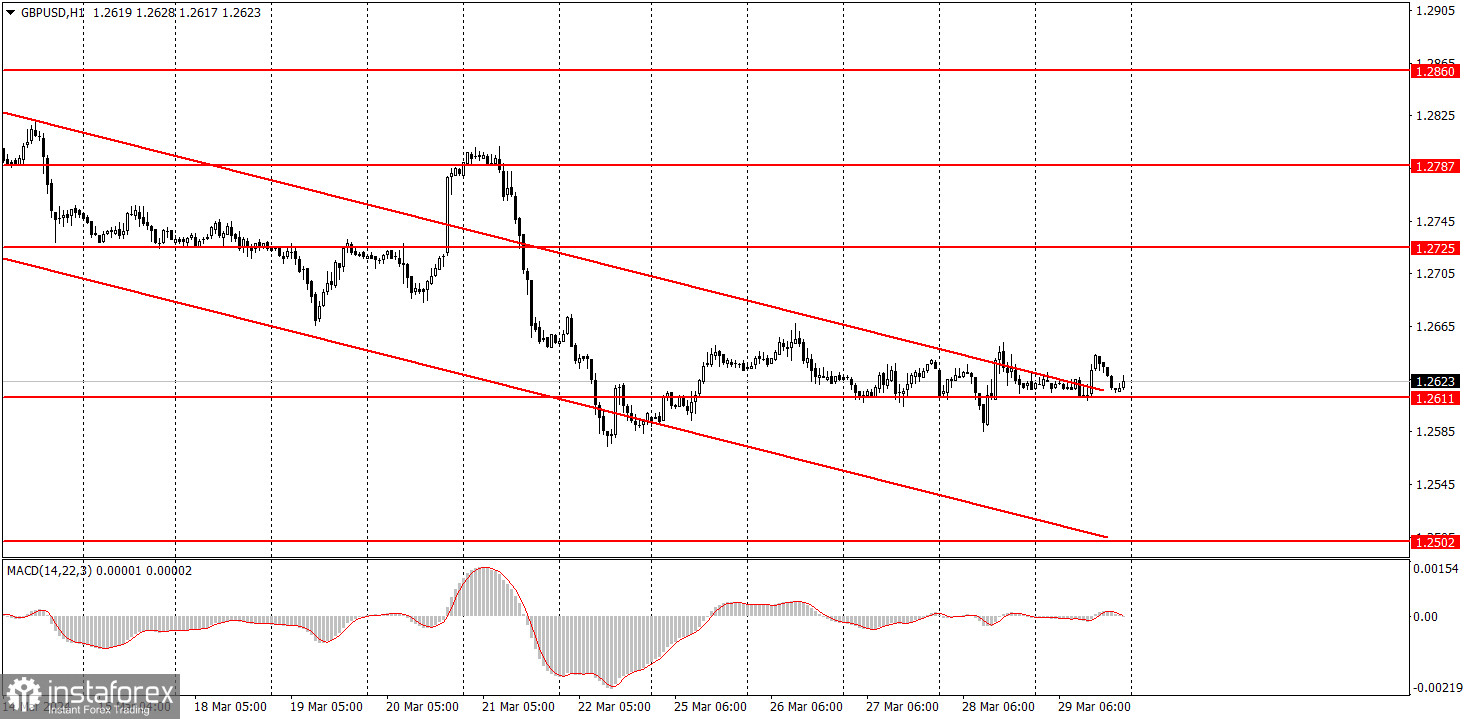
The GBP/USD pair traded flat amid low volatility on Friday. The price settled above the descending channel, but this doesn't mean that the pair will start an upward trend. Let me remind you that there are no trading signals in a flat phase. All the lines, levels, and patterns are no longer valid. In fact, a flat phase signifies the absence of transactions in the market. If trades are not opened, there is no movement, so technical analysis loses its power. At least the part of it that concerns trends. Breaking out of the channel is also a signal of a trend reversal. Currently, there is no such signal because we have a flat phase even on the hourly chart.
So now we need to wait for the next flat phase to end, and only then should we consider the possibility of entering the market. Of course, you can try to trade on the rebound from the level of 1.2611, but on the 5-minute timeframe, it is clearly visible what kind of movements such signals lead to. It's unlikely that anyone is interested in a profit of 10 pips...
GBP/USD on 5M chart
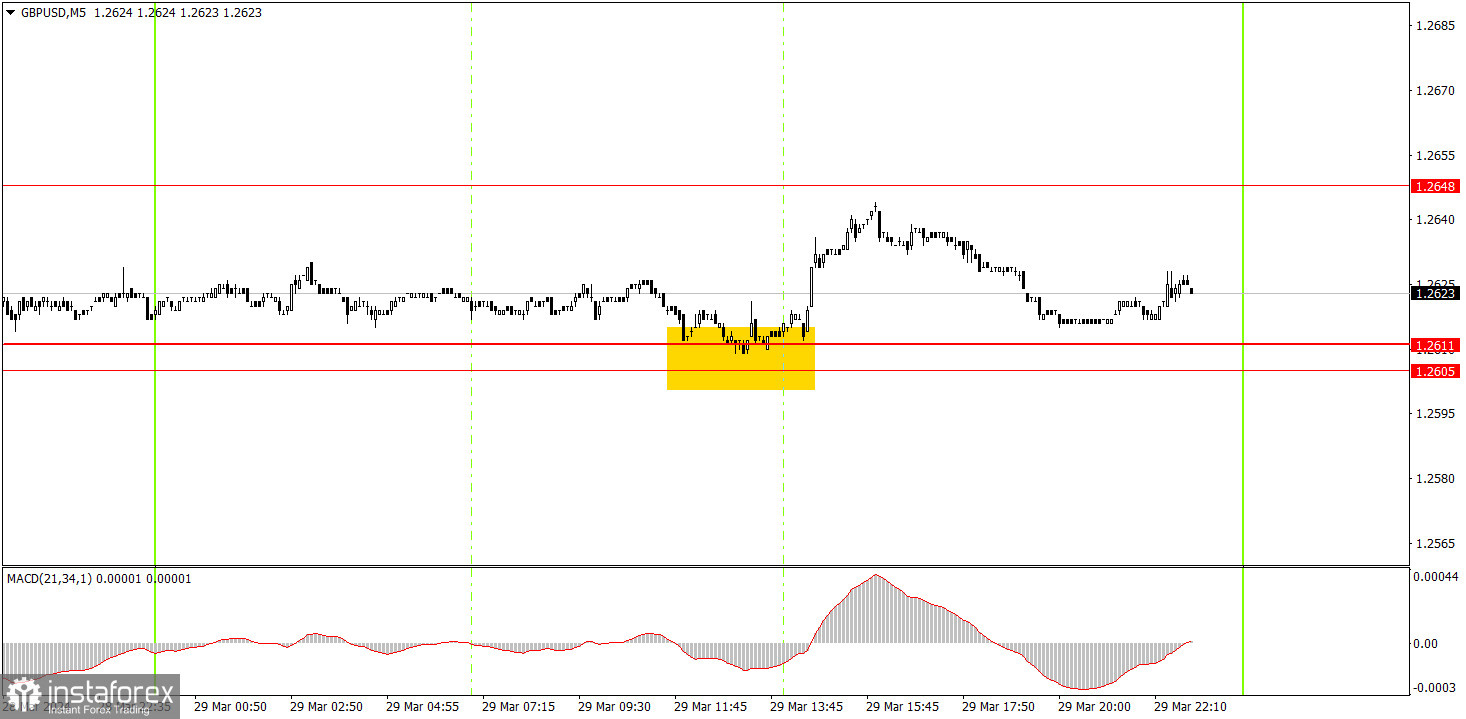
On the 5-minute timeframe, a buy signal was formed after a rebound from the 1.2605-1.2611 area. After that, the price managed to rise by about 20 pips, so we could even say that the market reacted to the US reports, which were published right at the beginning of the US session. However, we don't even consider this reaction, as such weak movements could simply be market noise. Nevertheless, even with such a weak movement, one could have made a profit of 10-15 pips based on the mentioned signal.
Trading tips on Monday:
On the hourly chart, the downtrend persists. Unfortunately, the market continues to trade in an illogical and sluggish way, and recently, it has been mostly moving sideways. The current movements are quite erratic, with hardly any logic in them. The pair may start an upward movement, but it will depend on the US macroeconomic background.
Today, there is nothing else to do but wait for signals around the 1.2605-1.2611 area. You can only work on rebounds from it or wait for the price to leave the area, which may slightly strengthen the movement and trigger a new decline in the pound. But in any case, we are talking about very weak movements right now.
The key levels on the 5M chart are 1.2372-1.2387, 1.2457, 1.2502, 1.2544, 1.2605-1.2611, 1.2648, 1.2691, 1.2725, 1.2787-1.2791, 1.2848-1.2860, 1.2913, 1.2981-1.2993. On Monday, we will highlight the US ISM Manufacturing PMI. This may be enough to stir some market reaction, so the volatility may gradually increase, but it is unlikely that we will see strong and trending movements throughout the day.
Basic trading rules:
1) Signal strength is determined by the time taken for its formation (either a bounce or level breach). A shorter formation time indicates a stronger signal.
2) If two or more trades around a certain level are initiated based on false signals, subsequent signals from that level should be disregarded.
3) In a flat market, any currency pair can produce multiple false signals or none at all. In any case, the flat trend is not the best condition for trading.
4) Trading activities are confined between the onset of the European session and mid-way through the U.S. session, after which all open trades should be manually closed.
5) On the 30-minute timeframe, trades based on MACD signals are only advisable amidst substantial volatility and an established trend, confirmed either by a trendline or trend channel.
6) If two levels lie closely together (ranging from 5 to 15 pips apart), they should be considered as a support or resistance zone.
How to read charts:
Support and Resistance price levels can serve as targets when buying or selling. You can place Take Profit levels near them.
Red lines represent channels or trend lines, depicting the current market trend and indicating the preferable trading direction.
The MACD(14,22,3) indicator, encompassing both the histogram and signal line, acts as an auxiliary tool and can also be used as a signal source.
Significant speeches and reports (always noted in the news calendar) can profoundly influence the price dynamics. Hence, trading during their release calls for heightened caution. It may be reasonable to exit the market to prevent abrupt price reversals against the prevailing trend.
Beginners should always remember that not every trade will yield profit. Establishing a clear strategy coupled with sound money management is the cornerstone of sustained trading success.


