


Trend analysis (Fig. 1).
The GBP/USD currency pair may move upward from the level of 1.2622 (closing of Friday's daily candle) to the 23.6% pullback level at 1.2649 (red dotted line). If this level is reached, a continued upward movement is likely possible to the 38.2% pullback level at 1.2733 (red dotted line).
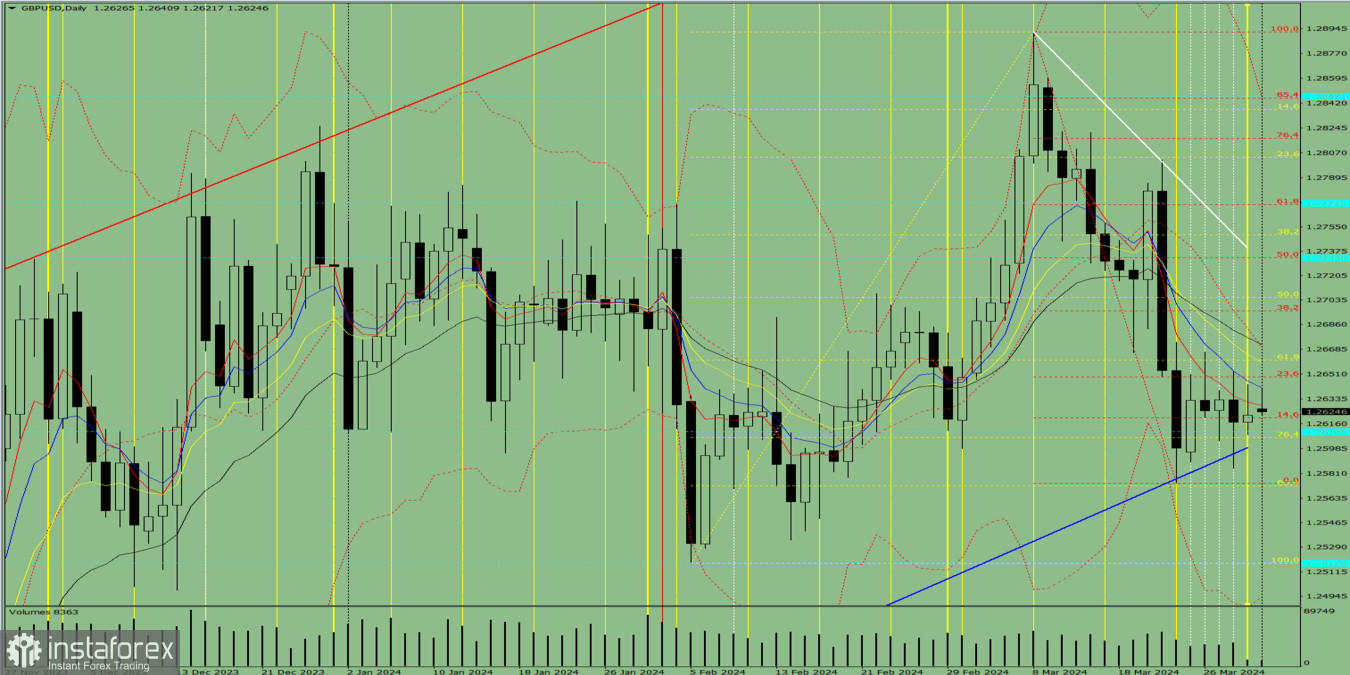
Fig. 1 (daily chart).
Comprehensive analysis:
- Indicator analysis – up;
- Fibonacci levels – up;
- Volumes – up;
- Candlestick analysis – down;
- Trend analysis – up;
- Bollinger bands – up;
- Weekly chart – up.
General conclusion: Today, the price may move upward from the level of 1.2622 (closing of Friday's daily candle) to the 23.6% pullback level at 1.2649 (red dotted line). If this level is reached, a continued upward movement is likely possible to the 38.2% pullback level at 1.2733 (red dotted line).
Alternatively, from the level of 1.2622 (closing of Friday's daily candle), the price may move upward to the 61.8% pullback level at 1.2661 (yellow dotted line). If this level is reached, a downward movement is possible to the 23.6% pullback level at 1.2649 (red dotted line).


