


Trend analysis (Fig. 1).
The EUR/USD currency pair may move downward from the level of 1.0743 (closing of yesterday's daily candle) to test the historical support level at 1.0723 (blue dotted line). After that, an upward movement is possible to the 14.6% pullback level at 1.0759 (red dotted line).
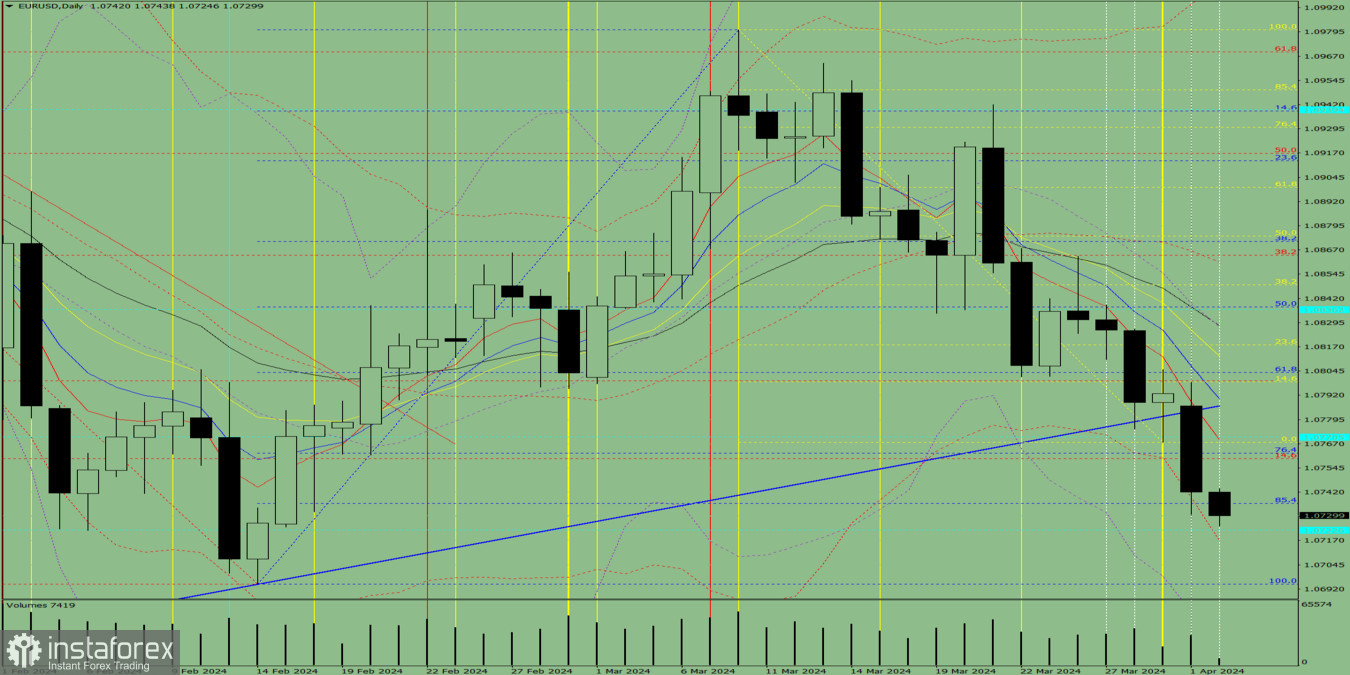
Fig. 1 (daily chart).
Comprehensive analysis:
- Indicator analysis – down;
- Volumes – down;
- Candlestick analysis – down;
- Trend analysis – down;
- Bollinger bands – down;
- Weekly chart – down.
General conclusion: Today, the price may move downward from the level of 1.0743 (closing of yesterday's daily candle) to test the historical support level at 1.0723 (blue dotted line). After that, an upward movement is possible to the 14.6% pullback level at 1.0759 (red dotted line).
Alternatively, from the level of 1.0743 (closing of yesterday's daily candle), the price may move downward to test the lower fractal at 1.0694 (blue dotted line). After that, an upward movement is possible to the 14.6% pullback level at 1.0759 (red dotted line).


