


EUR/USD
Higher Timeframes
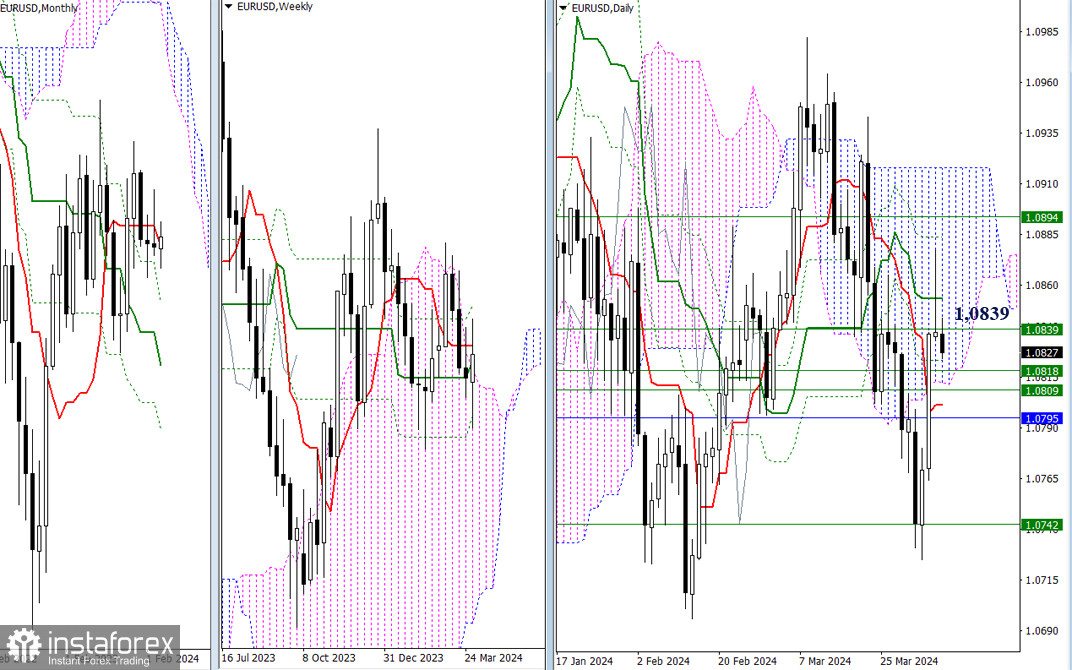
Bulls threw a long upper shadow on Thursday, but by the end of the day, the market returned below the weekly short-term trend (1.0839). As a result, the nearest resistances maintain their strength and significance, remaining today at the levels of 1.0854 – 1.0884 (final levels of the daily Ichimoku cross) – 1.0894 (weekly Fibonacci Kijun) – 1.0918 (upper boundary of the daily cloud).
In the current conditions, bears may need considerable effort to implement the decline and return to the weekly support (1.0742), as all levels (1.0818 – 1.0809 – 1.0795) that the opponent has easily overcome in recent days may now act in defense of its interests and restrain bearish sentiment. Today, we close the week, so the character of the weekly candle depends on the outcome of the day.
H4 – H1
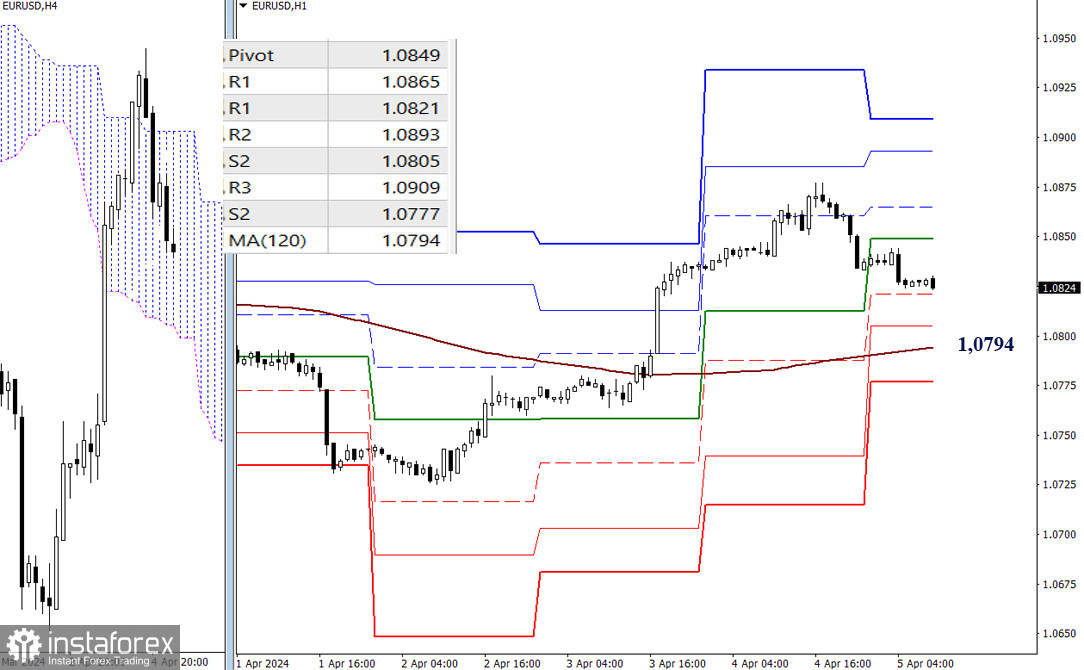
On lower timeframes, a corrective decline is currently observed. There are opportunities for a deeper correction, as the key support responsible for the current balance of power is now at 1.0794 (weekly long-term trend). Its breakdown and reversal may give the main advantage to bears. After the trend breaks, the classic pivot point S3 (1.0777) may become an additional bearish target within the day.
If the corrective decline is stopped, then in the event of an upward movement, bulls will need to overcome the resistances of the classic pivot points (1.0849 – 1.0865 – 1.0893 – 1.0909).
***
GBP/USD
Higher Timeframes
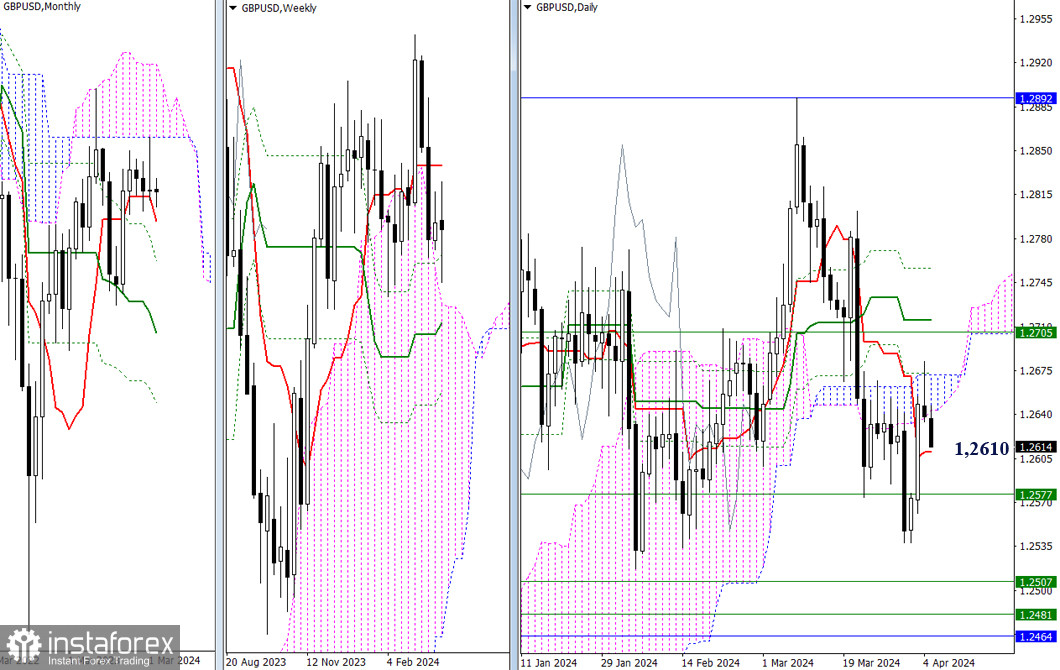
Bears halted the opponent's advance yesterday, forming a small rebound from the daily cloud (1.2643 – 1.2671). For the bulls, the daily cloud (1.2643-71) and the weekly short-term trend (1.2705) remain the main immediate obstacles on this part of the chart. Currently, the market is in the attraction zone of the daily short-term trend (1.2610). The nearest support in case of continued decline is the weekly Fibonacci Kijun (1.2577). A candlestick closure of uncertainty at the end of the week will maintain the market's indecisiveness and uncertainty.
H4 – H1
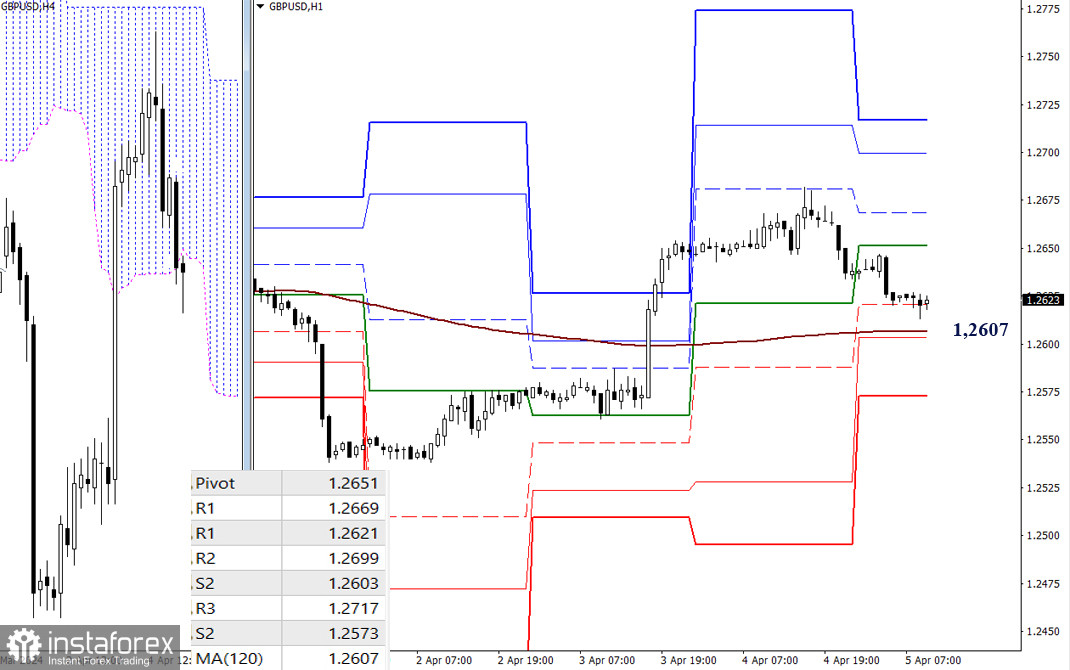
As of writing, the pair is in a corrective decline, approaching a test of the key support of the weekly long-term trend (1.2607). Note that the long-term trend represents a kind of balance and is responsible for the current distribution of forces. Trading above this level provides an advantage to bulls; today, strengthening bullish sentiment is possible through the passage of the resistances of the classic pivot points (1.2651 – 1.2669 – 1.2699 – 1.2717). A break and consolidation below the trend will shift attention to bearish prospects, and support S3 (1.2573) of the classic pivot points may be significant on this path.
***
The technical analysis of the situation uses:
Higher timeframes - Ichimoku Kinko Hyo (9.26.52) + Fibonacci Kijun levels
Lower timeframes - H1 - Pivot Points (classic) + Moving Average 120 (weekly long-term trend)


