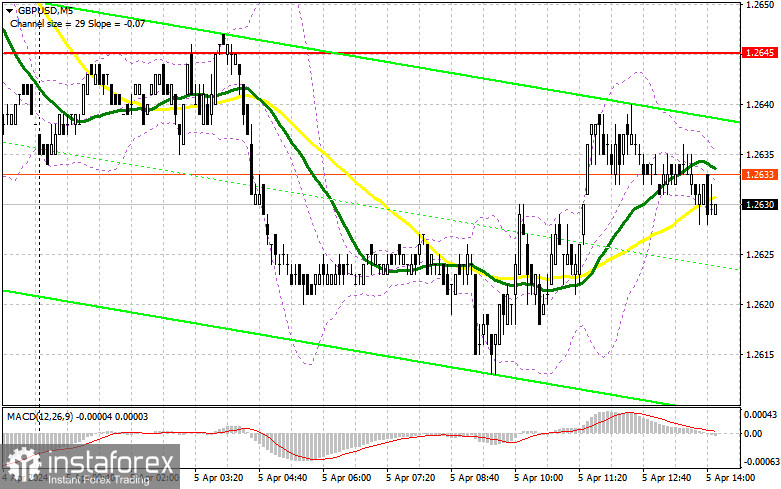
In my morning forecast, I pointed out the level of 1.2645 and planned to base my market entry decisions on it. Let's look at the 5-minute chart and analyze what happened there. There was a rise, but before testing the false breakout formation around 1.2645 in the first half of the day, we missed it by a few points, so I didn't enter the market. The technical picture remained unchanged for the second half of the day.

To open long positions on GBP/USD, it is required:
Obviously, the released data on construction activity in the UK didn't concern many, especially when the data didn't deviate much from economists' expectations. This allowed the demand for the British pound to remain in the first half of the day, but the development of an upward trend did not occur. In the second half of the day, everything might change: we await data on the US unemployment rate, as well as the number of employed in the non-farm sector and the average hourly wage. Active growth in new jobs in March will lead to a sharp decline in GBP/USD, which will negate all plans of buyers to build an upward trend. Weak data is a reason to open long positions on the pound to continue the bullish market development with the renewal of the weekly maximum and consolidation at that level. Speeches by FOMC members Thomas Barkin and Michelle Bowman are unlikely to lead to changes in the market.
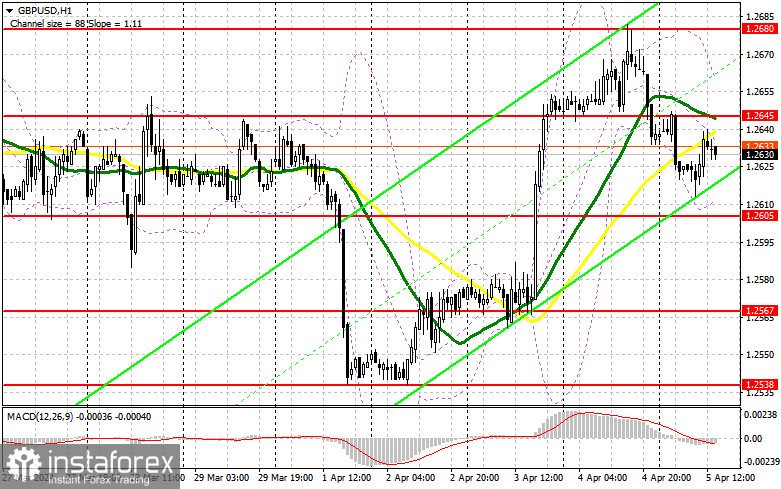
If pressure on the pair increases in the second half of the day after the data, before entering the market, I will wait for the formation of a false breakout around the support at 1.2605, which we also didn't reach during the European session. This will give a chance for a demand return with the prospect of reaching 1.2645, where the moving averages intersect. Breaking and consolidating above this range will strengthen bullish positions and open the way to 1.2680. The ultimate target will be the maximum at 1.2724, where I plan to make a profit. In the scenario of GBP/USD decline and lack of bullish activity at 1.2605 in the second half of the day, the pair will return to decline, allowing sellers to gain momentum. In this case, only a false breakout around the next support at 1.2567 will confirm the correct entry point. I plan to buy GBP/USD immediately on a rebound from 1.2538 with a target of a 30-35 point correction within the day.

To open short positions on GBP/USD, it is required:
Bears also have a good chance to pressure the pound, but for this, good US statistics are needed. Today, I plan to act after defending the resistance at 1.2645, which we failed to reach in the first half of the day. A false breakout there will confirm the correct entry point for selling in continuation of the downward correction, leading to a downward movement towards 1.2605. Breaking and retesting this range from bottom to top after a strong labor market report will deal another blow to bullish positions, leading to stop-loss triggering and opening the way to 1.2567. I expect larger buyers to appear there. The ultimate target will be the area around 1.2538, coinciding with the weekly minimum, where profit will be taken. In the scenario of GBP/USD growth and lack of activity at 1.2645 in the second half of the day, buyers will continue to build a new bullish market. In this case, I will postpone selling until a false breakout at 1.2680. If there is no downward movement there, I will sell GBP/USD immediately on a rebound from 1.2724, but only expecting a pair correction down by 30-35 points within the day.
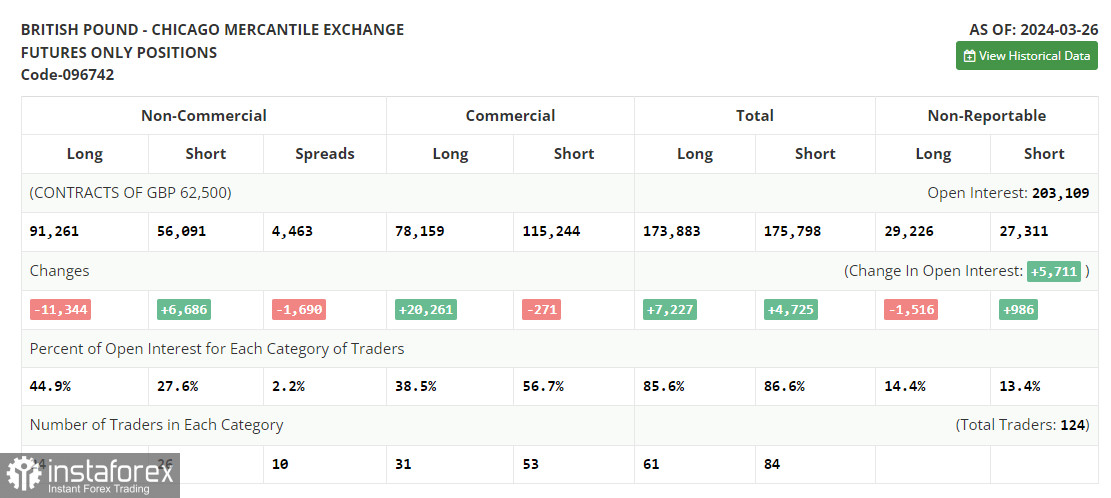
In the COT report (Commitment of Traders) for March 26th, there was a sharp decrease in long positions and an increase in short positions. After the Bank of England meeting and statements by Governor Andrew Bailey, the regulator's dovish position became clear to everyone, to which the pound reacted with a decline. Most likely, the bearish market development will continue further, as, despite Fed Chairman Jerome Powell's inclination towards a dovish policy, many of his colleagues advocate a more restrained approach, which maintains the chances of a strong US dollar. For this reason, I bet on further pair decline. In the latest COT report, it is stated that long non-commercial positions decreased by 11,344 to 91,261, while short non-commercial positions increased by 6,686 to 56,091. As a result, the spread between long and short positions decreased by 1,690.

Indicator signals:
Moving Averages
Trading is conducted around the 30 and 50-day moving averages, indicating a sideways market.
Note: The period and prices of moving averages are considered by the author on the hourly chart H1 and differ from the general definition of classical daily moving averages on the daily chart D1.
Bollinger Bands
In case of a decline, the lower boundary of the indicator, around 1.2610, will act as support.
Description of Indicators:
• Moving average (determines the current trend by smoothing volatility and noise). Period 50. Marked in yellow on the chart.
• Moving average (determines the current trend by smoothing volatility and noise). Period 30. Marked in green on the chart.
• MACD indicator (Moving Average Convergence/Divergence). Fast EMA period 12. Slow EMA period 26. SMA period 9.
• Bollinger Bands. Period 20.
• Non-commercial traders - speculators, such as individual traders, hedge funds, and large institutions, using the futures market for speculative purposes and meeting certain requirements.
• Long non-commercial positions represent the total long open position of non-commercial traders.
• Short non-commercial positions represent the total short open position of non-commercial traders.
• The total non-commercial net position is the difference between the short and long positions of non-commercial traders.


