


Trend analysis
GBP/USD may resume an upward movement this week, starting from the level of 1.2634 (closing price of the last weekly candle) to the 61.8% retracement level of 1.2719 (red dashed line). Following this, the pair will climb to the 14.6% retracement level of 1.2766 (blue dashed line).
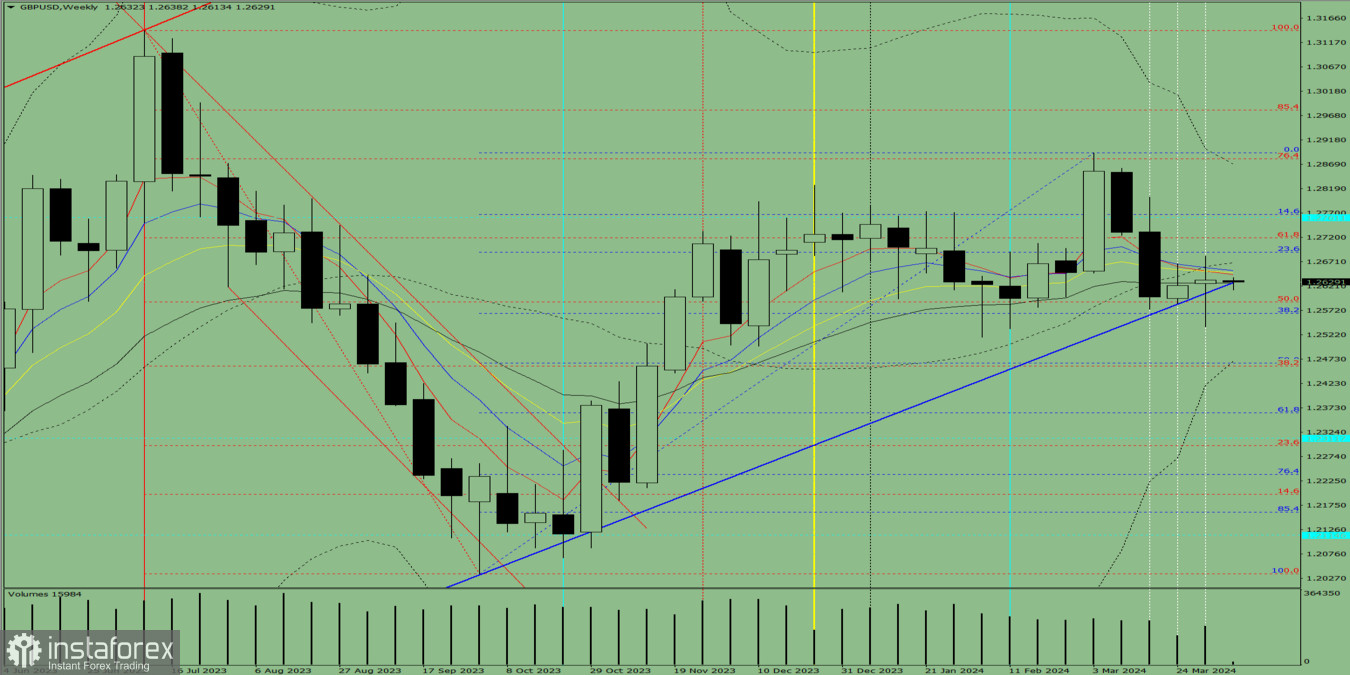
Fig. 1 (weekly chart)
Comprehensive analysis:
Indicator analysis - upward
Fibonacci levels - upward
Volumes - upward
Candlestick analysis - upward
Trend analysis - upward
Bollinger bands - upward
Monthly chart - upward
Conclusion: The indicators point to an upward movement in GBP/USD.
Overall conclusion: The pair will have a bullish trend, with no first lower shadow on the weekly white candle (Monday - upward) and a second upper shadow (Friday - downward).
So, during the week, pound will rise from 1.2634 (closing price of the last weekly candle) to the 61.8% retracement level of 1.2719 (red dashed line), and then move toward the 14.6% retracement level of 1.2766 (blue dashed line).
Alternatively, it could climb from 1.2634 (closing price of the last weekly candle) to the 61.8% retracement level of 1.2719 (red dashed line), followed by a pullback to the 23.6% retracement level of 1.2690 (blue dashed line).


