


EUR/USD
Analysis:
The daily chart scale of the major pair of the euro since last July demonstrates a downward trend. By now, the quotes have reached the boundary of a strong potential reversal zone. The structure of the wave during the last three months is developing in the final part (C). Last week, the price broke through strong support, turning it into resistance.
Forecast:
During the upcoming week, price fluctuations of the euro are expected to transition predominantly into a sideways movement. In the first half, a gradual upward retracement towards the upper boundary of the price channel is more likely. The resumption of price decline can be expected closer to the weekend.
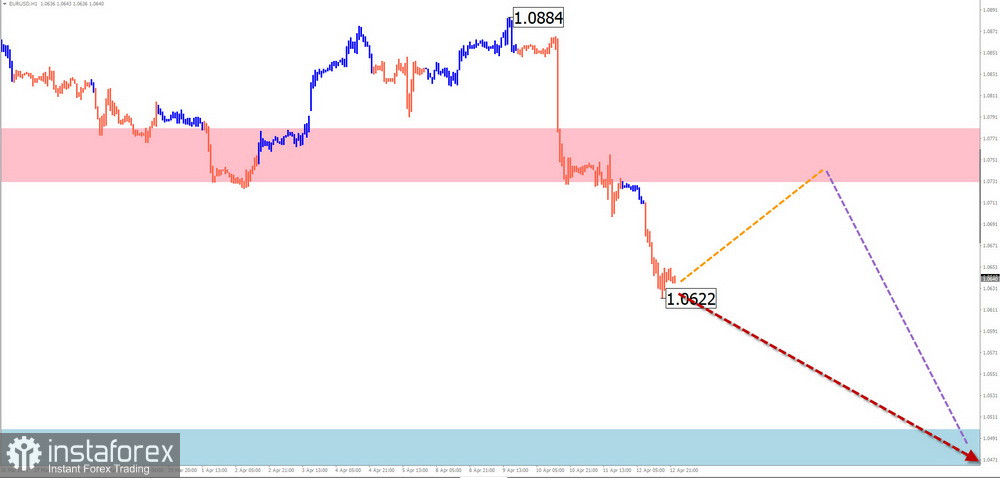
Potential Reversal Zones
Resistance:
- 1.0730/1.0780
Support:
- 1.0500/1.0450
Recommendations:
Buying: can be quite risky. Transactions may occur within intraday trading with fractional volumes.
Selling: conditions for such transactions will be present once confirmed reversal signals appear near the resistance zone.
USD/JPY
Analysis:
The trend direction of the main pair of the Japanese currency since last summer has been set by an ascending wave. The unfinished segment has been accounted for since March 8th, determining the direction of the pair's short-term fluctuations. Since the end of last month, the price has been forming a corrective figure in the form of a shifting plane, which still needs to be completed.
Forecast:
At the beginning of the upcoming week, a movement along a strong potential reversal zone of a large time frame towards the resistance zone is expected. Closer to the weekend, a change in direction and conditions for the resumption of downward price movement can be anticipated down to the area of calculated support.
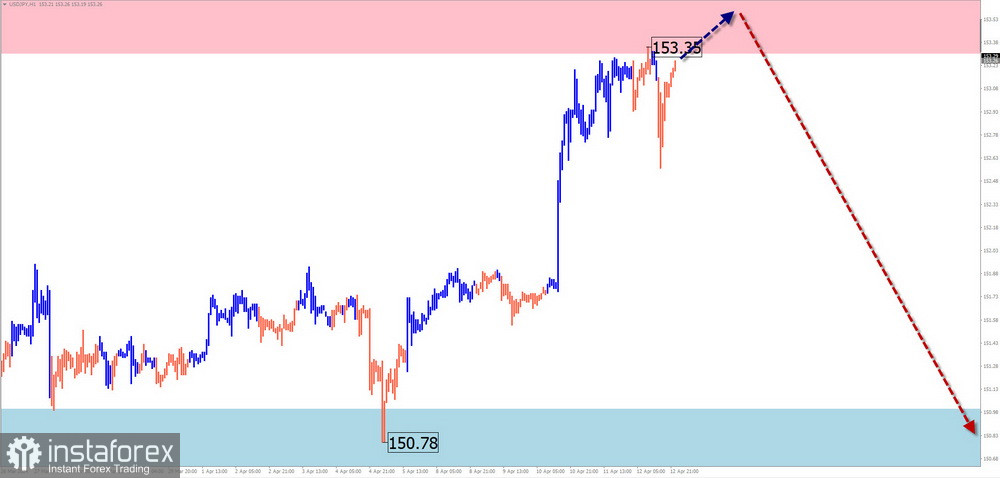
Potential Reversal Zones
Resistance:
- 153.30/153.80
Support:
- 151.00/150.50
Recommendations:
Selling: such transactions are premature until reversal signals appear.
Buying: conditions for such transactions won't be present in the pair's market in the coming days.
GBP/JPY
Analysis:
The direction of the Japanese currency pair against the pound has been moving upward in recent years, as determined by an ascending trend. The unfinished wave segment has been accounted for since December 7th, determining the direction of the pair's short-term fluctuations. Since January, the price has been forming a correctional figure in the form of a shifting plane, which still needs to be completed.
Forecast:
The pair's price will continue moving sideways within the designated price channel during the upcoming week. In the first few days, a gradual movement from the support zone to the calculated resistance area is more likely. Further, a transition into a sideways movement can be expected, creating conditions for the resumption of downward price movement.
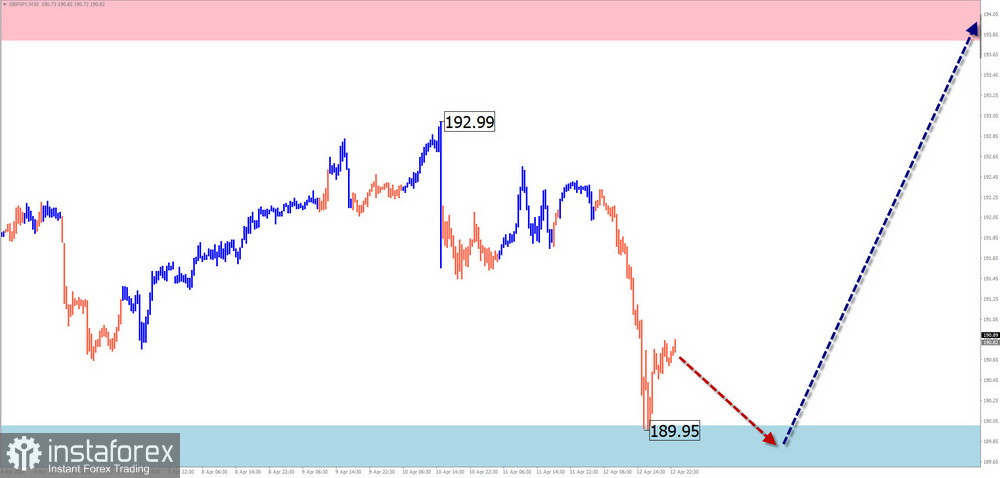
Potential Reversal Zones
Resistance:
- 193.80/194.30
Support:
- 190.00/189.50
Recommendations:
Selling: conditions for such transactions will be present once the entire current wave is completed.
Buying: fractional volumes can be used within individual trading sessions. The resistance zone limits potential.
USD/CAD
Analysis:
When analyzing the short-term prospects of the major pair of the Canadian dollar, attention should be paid to the unfinished bullish wave since December 27th of last year. Last week, the price surged upward through the intermediate resistance zone, turning it into support. The structure of the corrective wave at the time of analysis still needs to be completed.
Forecast:
At the beginning of the upcoming week, a short-term decrease is expected down to the support boundaries. Subsequently, a change in direction and the resumption of the upward movement vector can be expected. The pair's price increase can be expected up to the calculated resistance boundaries.
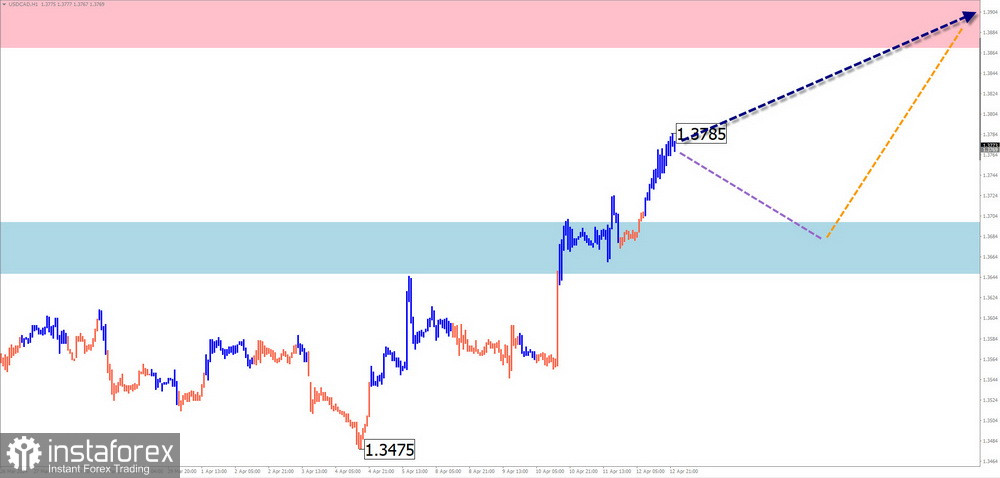
Potential Reversal Zones
Resistance:
- 1.3870/1.3920
Support:
- 1.3700/1.3650
Recommendations:
Selling: quite risky. It is safer to use fractional volumes within individual trading sessions.
Buying: such transactions will become relevant after confirmed reversal signals appear near the calculated support zone on your trading system.
NZD/USD
Analysis:
The direction of short-term fluctuations of the New Zealand dollar since a descending plane algorithm was defined last summer. The structure is nearing the completion of the final part (C). The calculated support passes through the upper boundary of the potential reversal zone of the daily time frame.
Forecast:
In the coming days, the most probable continuation of price decline. In the calculated support zone area, a transition of price fluctuations into a sideways movement can be expected, creating conditions for a change in the movement vector. The resumption of the price increase is likely closer to the weekend.
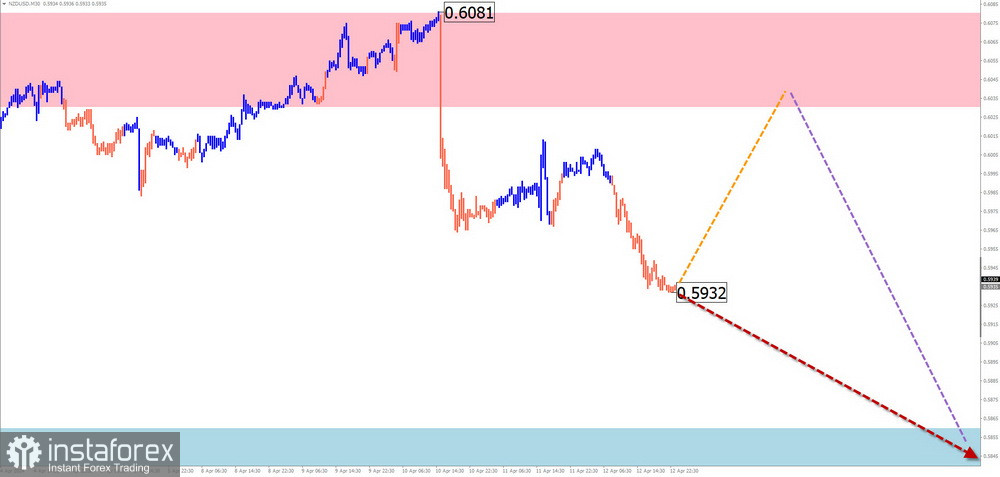
Potential Reversal Zones
Resistance:
- 0.6030/0.6080
Support:
- 0.5860/0.5810
Recommendations:
Selling: fractional volumes can be used within individual trading sessions.
Buying: transactions will become relevant after confirmed signals appear in the support zone.
Gold
Analysis:
The ascending wave of gold, which started in September of last year, brought the quotes to the area of a powerful potential reversal zone of the weekly chart scale. This wave's last unfinished part has been counted since March 21st. For most of last week, gold prices corrected sideways.
Forecast:
A continuation of flat movement is expected in the next couple of days. A decline in quotes to the support boundaries cannot be ruled out. Further, a resumption of price increases and growth to the resistance boundaries can be expected.
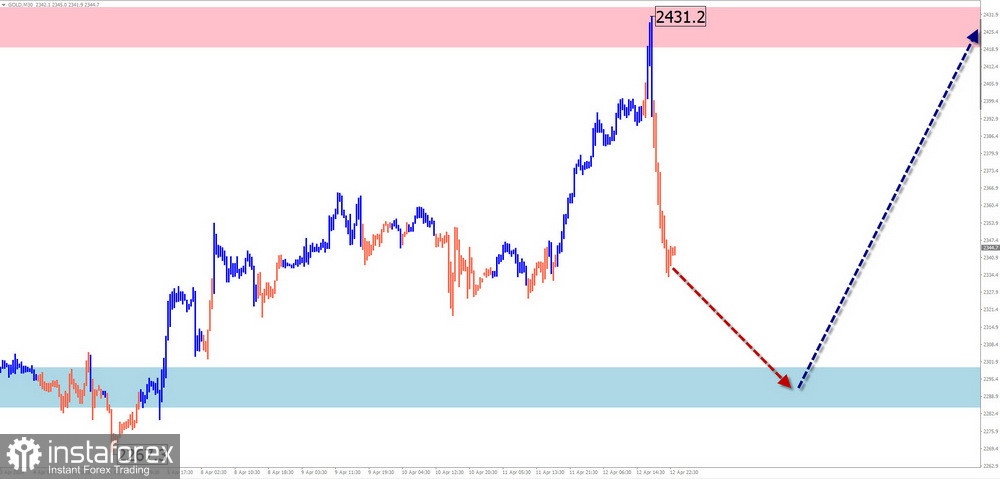
Potential Reversal Zones
Resistance:
- 2420.0/2435.0
Support:
- 2300.0/2285.0
Recommendations:
Selling: risky. Transactions with fractional volumes are allowed within individual trading sessions.
Buying: transactions will become relevant after confirmed reversal signals appear near the support zone on your trading system.
Explanation: In simplified wave analysis (SWA), all waves consist of 3 parts (A-B-C). During each time frame, the last unfinished wave is analyzed. Dashed lines indicate expected movements.
Attention: The wave algorithm does not consider the duration of movements in time!


