


EUR/USD
Higher Timeframes
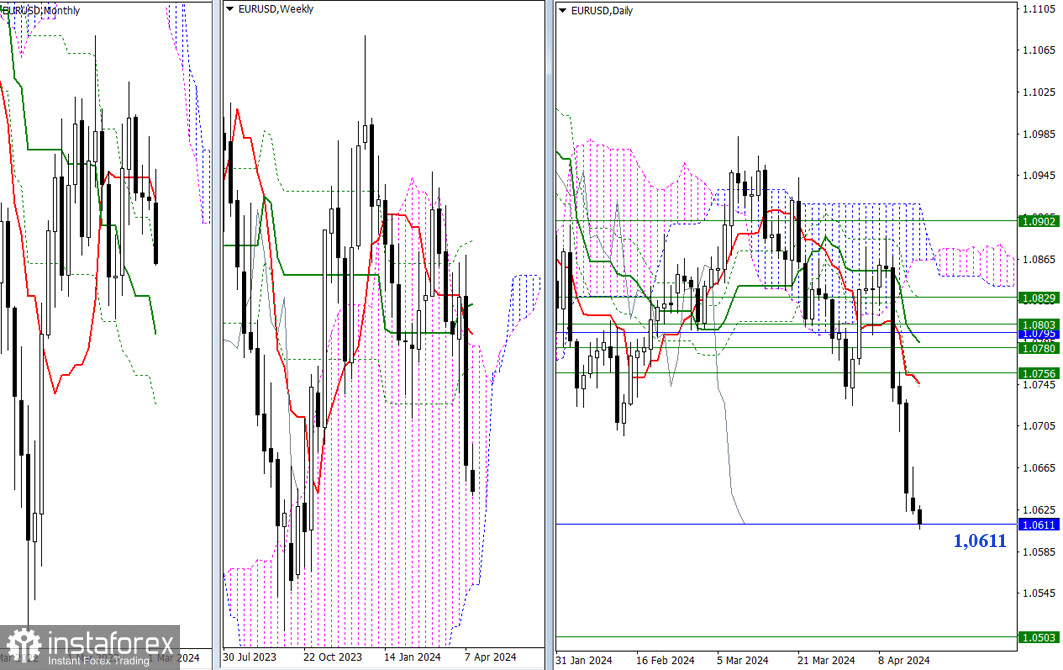
The bears have started testing the monthly support level (1.0611). The outcome may determine the pair's possible movement. The next support level after breaking the current one (1.0611) will be the lower boundary of the weekly cloud (1.0503). In the event of a rebound, the first resistance may be provided by the daily short-term trend, which is currently at 1.0746, and with each passing day, it will move closer to the price chart.
H4 – H1
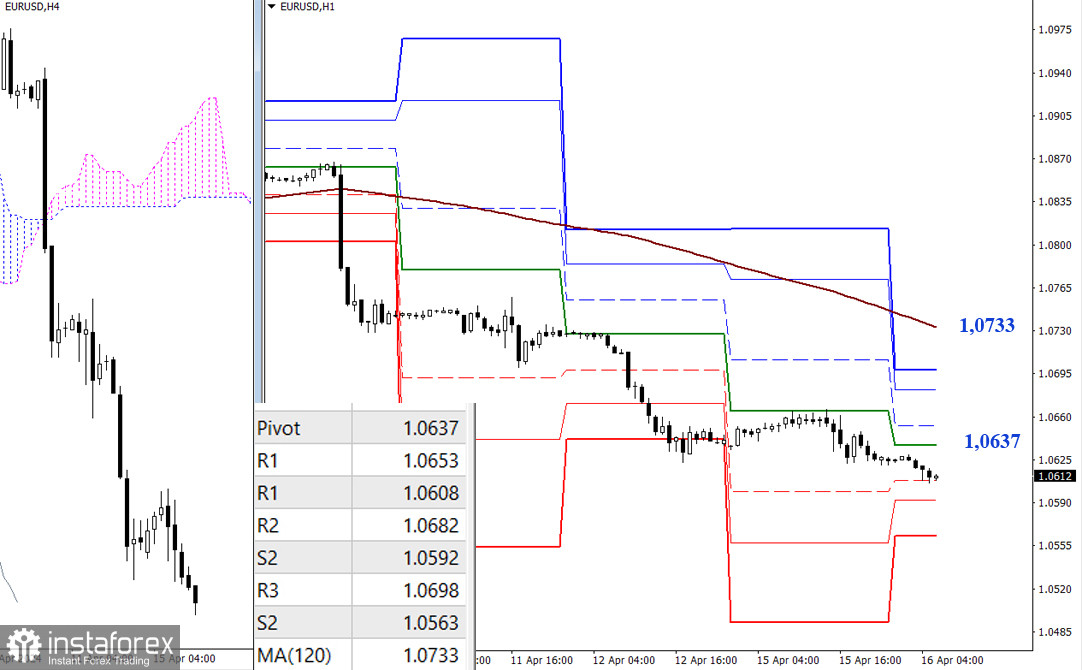
On lower timeframes, the bears have left the correction zone and the pair continues to move downwards. Currently, the first support that is being tested is the classic Pivot point (1.0608). Beyond that lies S2 (1.0592) and S3 (1.0563). In case the bulls are active, the focus will be on the resistance levels, which can be found at 1.0637 – 1.0653 – 1.0682 – 1.0698 – 1.0731 (classic Pivot levels + weekly long-term trend)
***
GBP/USD
Higher Timeframes
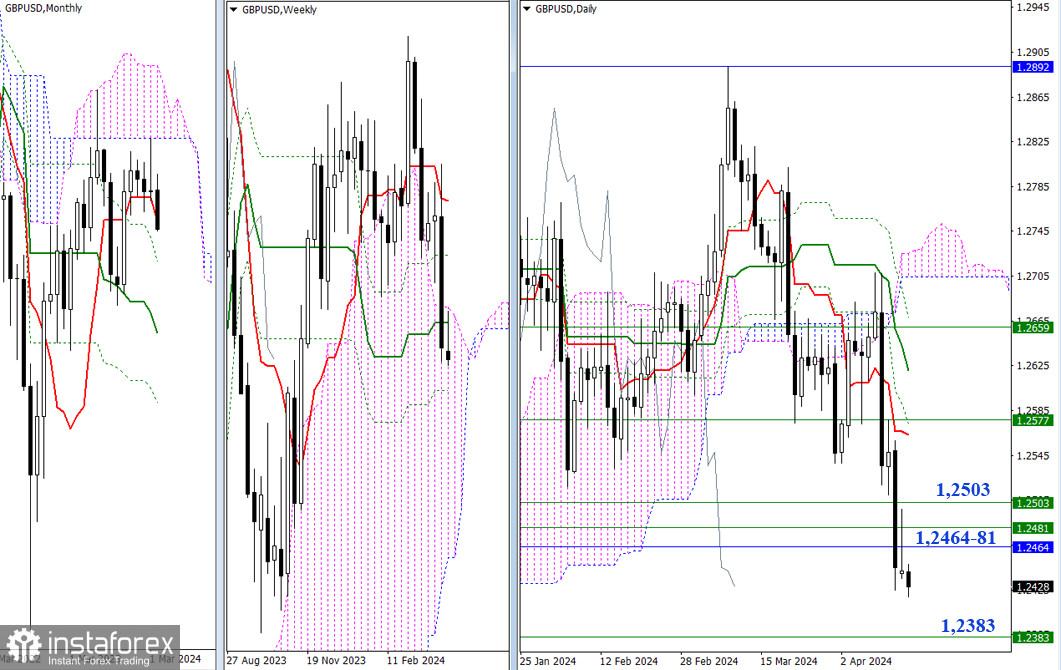
Yesterday, the pair closed below the nearest resistance zone that has been tested (1.2464 – 1.2481 – 1.2503). The pair could rise if the price consolidates above the specified resistance levels. As for the bears, if the pair continues to fall, the next support could be found at the final level of the weekly Ichimoku Golden Cross (1.2383).
H4 – H1
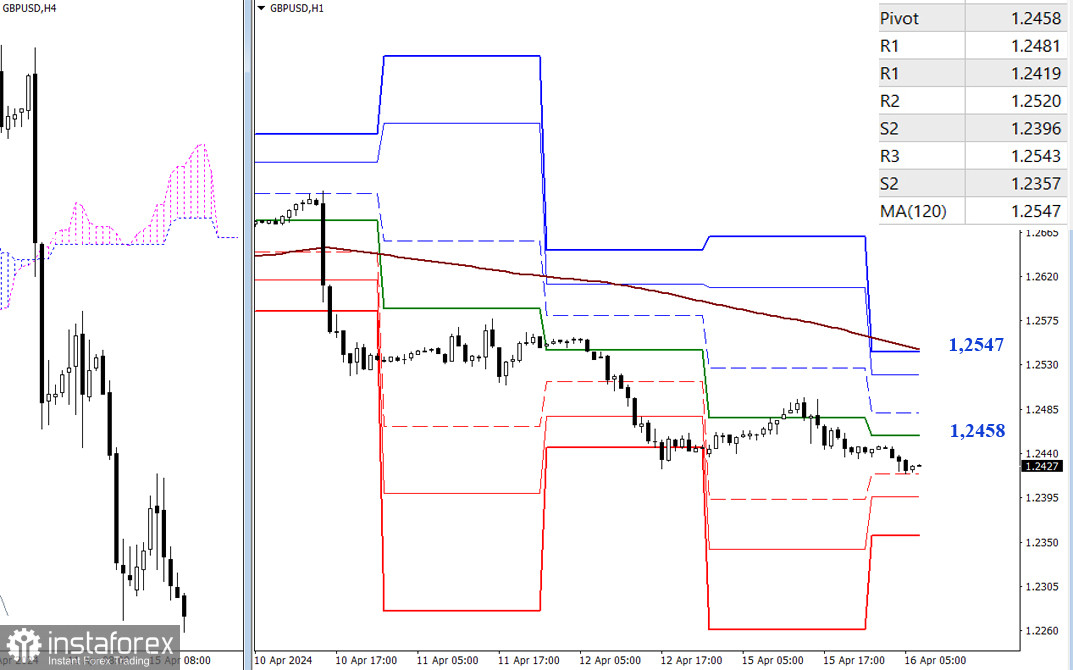
The bears supported the downward movement and helped the price break out of the bullish correction, developing a downward trend. Therefore, sellers have the advantage at the moment. Currently, the first support of the classic Pivot levels (1.2419) is being tested, followed by the S2 (1.2396) and S3 (1.2357) supports. In case the pair corrects higher, the intraday bullish targets for today will be 1.2458 – 1.2481 – 1.2520 – 1.2547 (classic Pivot levels + weekly long-term trend).
***
The technical analysis of the situation uses:
Higher timeframes - Ichimoku Kinko Hyo (9.26.52) + Fibonacci Kijun levels
Lower timeframes - H1 - Pivot Points (classic) + Moving Average 120 (weekly long-term trend)


