


Analysis of EUR/USD 5M
EUR/USD kicks off the new week by moving within a formal ascending channel. The pair edged up while volatility was low, which basically corresponds to the status of a "boring Monday." Traders could only pay attention to one report. The inflation rate in Germany remained unchanged at 2.2% in April. Since this was a minor deviation from the forecast and the value itself remained unchanged, there was practically no market reaction. Furthermore, this was only about one country in the European Union. Today, the Consumer Price Index for the entire EU will be published, so we can expect a stronger reaction from the market.
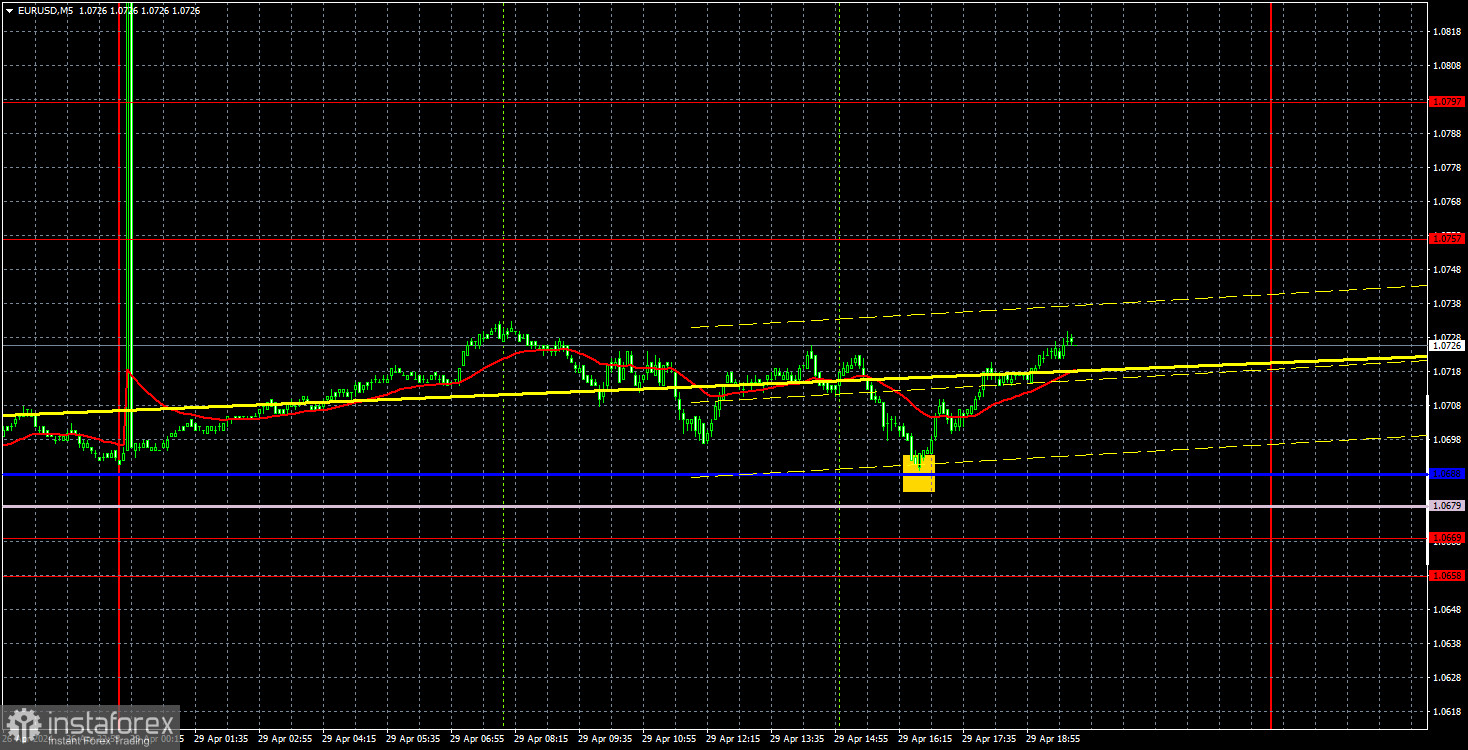
The technical picture did not change. If we ignore the "technical glitch," absolutely nothing has changed. The pair continues to correct higher, and as long as the price does not leave the ascending channel, there is no reason to expect a decline. However, take note that the single currency is trading both logically and predictably, unlike the British pound. In order to consider short positions, it is necessary to wait for the price to consolidate below the channel and the lines of the Ichimoku indicator.
Only one trading signal was formed on the 5-minute timeframe. A bounce from the critical line during the US trading session. However, traders could still earn profit using this signal even amidst low volatility, as it was the lowest point of the day. After this signal was formed, the price managed to rise by about 30 pips in the evening.
COT report:
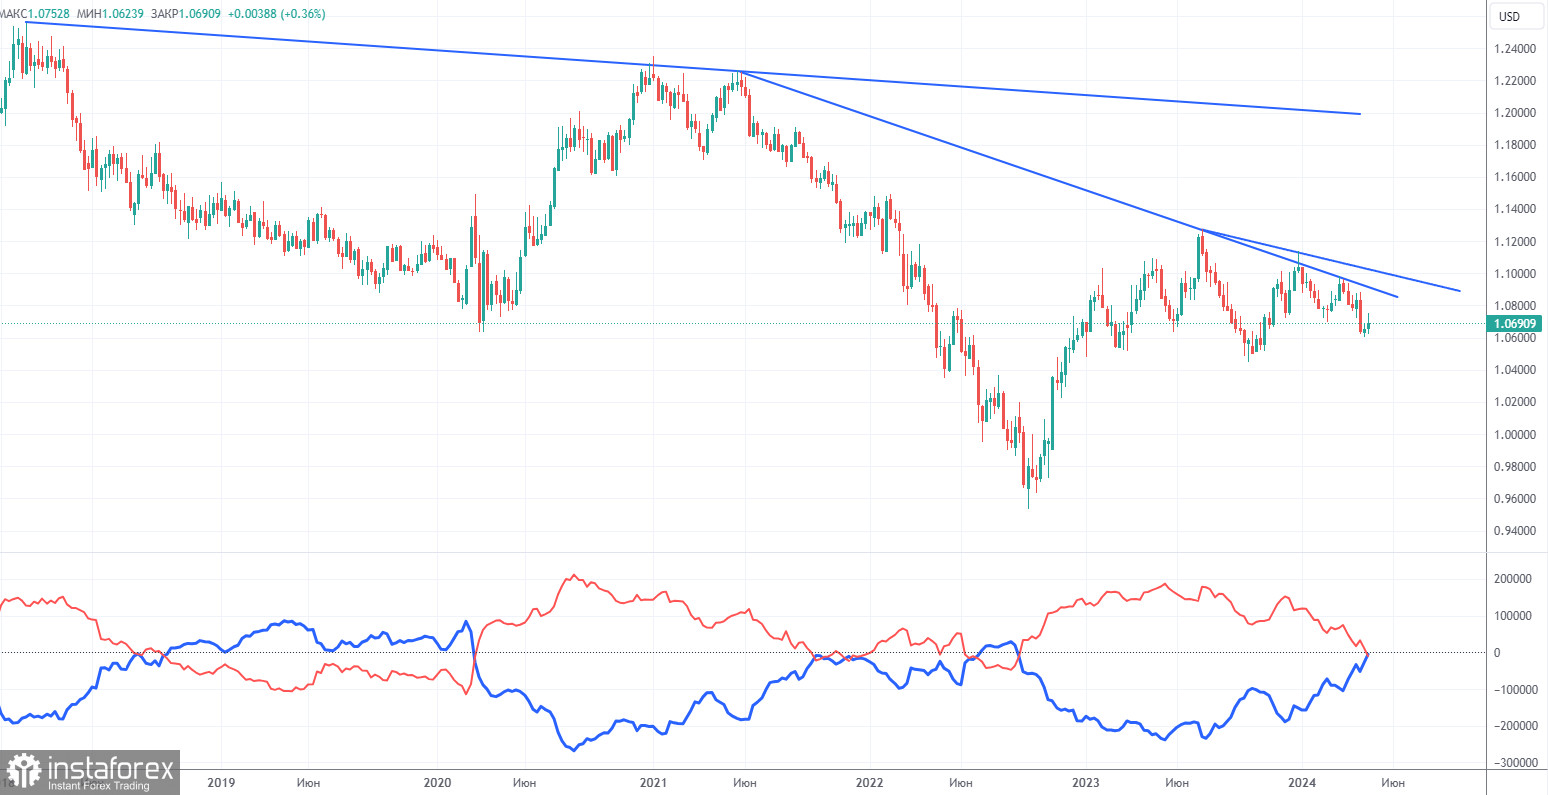
The latest COT report is dated April 23. The net position of non-commercial traders has been bullish for quite some time, but now the situation has finally changed. The net position of non-commercial traders (red line) has been decreasing in recent months, while that of commercial traders (blue line) has been increasing. This shows that market sentiment is turning bearish, as speculators increasingly sell the euro. Currently, their positions coincide in terms of volume. We don't see any fundamental factors that can support the euro's strength, while technical analysis also suggests a downtrend. Three descending trend lines on the weekly chart indicate that there's a good chance of sustaining the decline.
The red and blue lines have crossed, and now bears may have a significant advantage. So we strongly believe that the euro will fall further. During the last reporting week, the number of long positions for the non-commercial group increased by 11,600, while the number of short positions increased by 10,600. Accordingly, the net position decreased by 22,200. Overall, both the euro and the net position continue to decline. The number of buy contracts is now lower than the number of sell contracts among non-commercial traders by 10,000.
Analysis of EUR/USD 1H
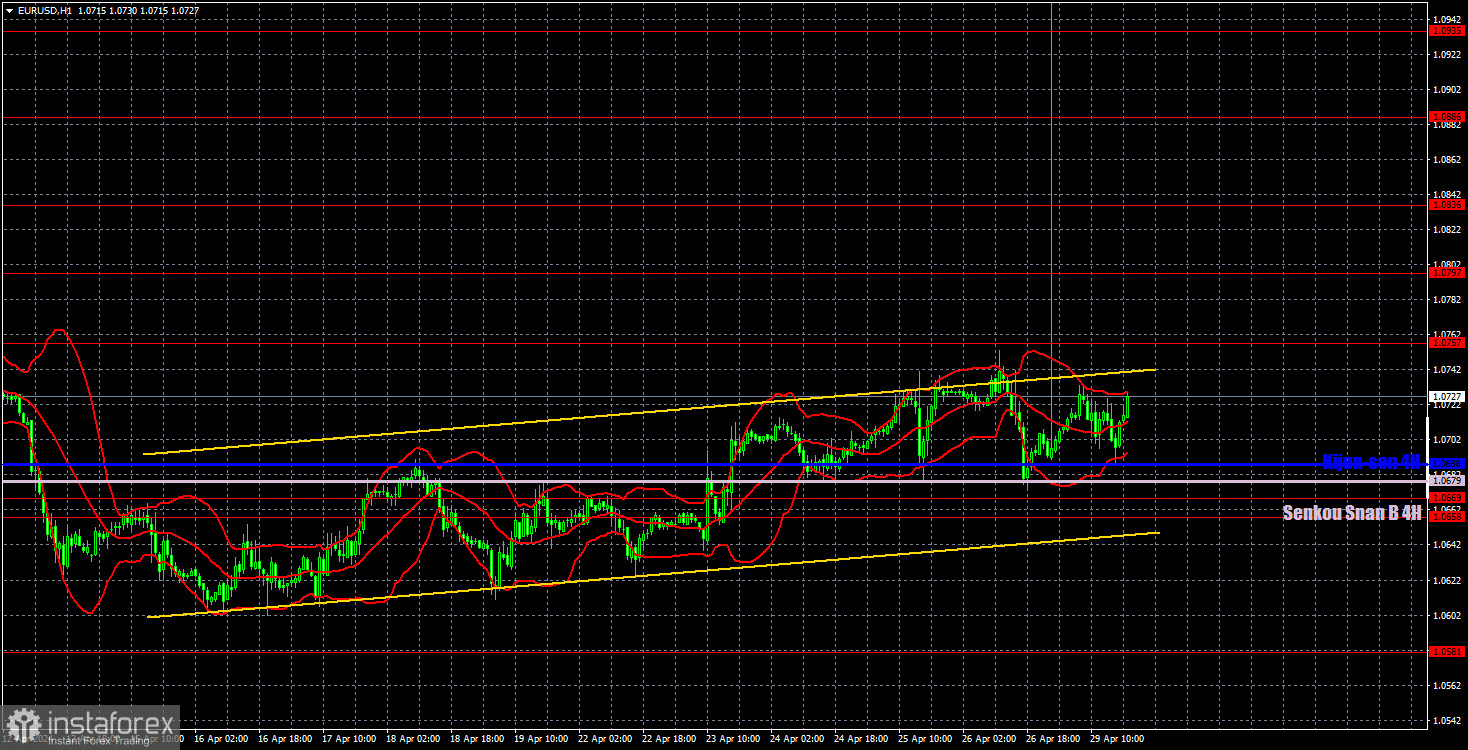
On the 1-hour chart, the downtrend persists but EUR/USD has remained in a flat phase for two weeks. Since expectations for a Federal Reserve rate cut in 2024 have significantly decreased, the US should rise in the medium term. Therefore, we should wait for the end of the current correction before we consider selling the pair. The targets in the 1.00-1.02 range remain unchanged for now.
On April 30, we highlight the following levels for trading: 1.0530, 1.0581, 1.0658-1.0669, 1.0757, 1.0797, 1.0836, 1.0886, 1.0935, 1.1006, 1.1092, as well as the Senkou Span B line (1.0679) and the Kijun-sen line (1.0688). The Ichimoku indicator lines can move during the day, so this should be taken into account when identifying trading signals. Don't forget to set a Stop Loss to breakeven if the price has moved in the intended direction by 15 pips. This will protect you against potential losses if the signal turns out to be false.
On Tuesday, Germany will release reports on retail sales, unemployment, and GDP for the first quarter. Market participants now look to the release of the inflation and GDP reports in the European Union. These reports alone could be enough to increase volatility. On the other hand, the US event calendar is empty. Currently, technical analysis takes precedence — the channel clearly indicates that the pair is still going through a correction. Working through the correction is not pleasant, and there are currently no signals to resume the downtrend.
Description of the chart:
Support and resistance levels are thick red lines near which the trend may end. They do not provide trading signals;
The Kijun-sen and Senkou Span B lines are the lines of the Ichimoku indicator, plotted to the 1H timeframe from the 4H one. They provide trading signals;
Extreme levels are thin red lines from which the price bounced earlier. They provide trading signals;
Yellow lines are trend lines, trend channels, and any other technical patterns;
Indicator 1 on the COT charts is the net position size for each category of traders;


