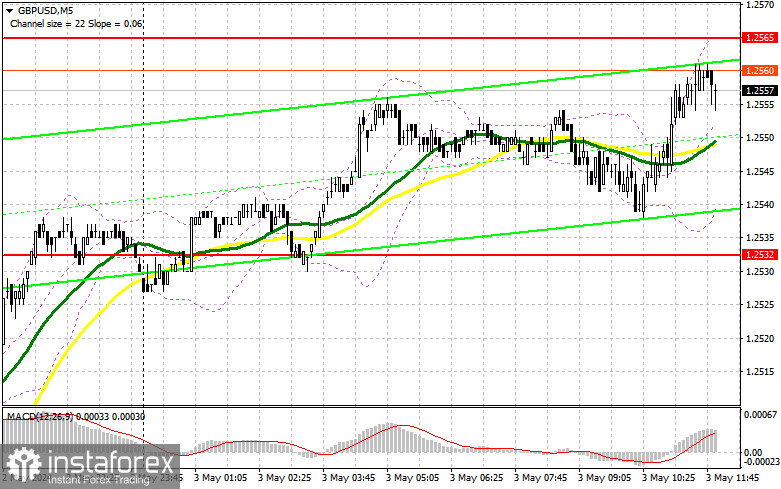
In my morning forecast, I focused on the level of 1.2565 and planned to make decisions regarding market entry based on it. Let's take a look at the 5-minute chart and analyze what happened there. Growth occurred, but we still didn't reach the test of 1.2565. Due to this, I didn't see any entry points into the market in the first half of the day. The technical picture remained unchanged for the second half of the day.

For opening long positions on GBP/USD, the following is required:
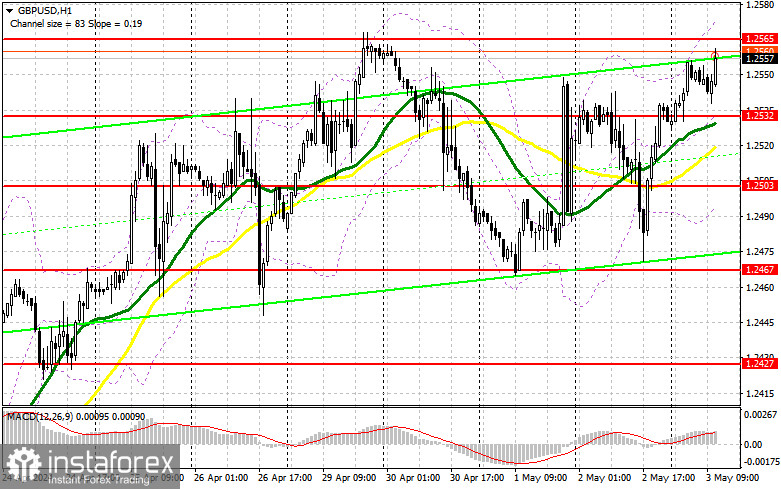
Quite decent data on the growth of activity in the UK services sector allowed the pound to recover in the first half of the day, but it is obvious that everyone is focused on US data, so market participants are not particularly optimistic. Only very weak indicators on changes in the number of employed in the non-agricultural sector and a decrease in average hourly earnings will lead to a new upturn in GBP/USD as part of the bullish trend. In the case of strong data, avoiding a decline in the pound is unlikely. In this case, I will act around 1.2532, where the moving averages are located. The formation of a false breakout there will provide an entry point for buying with the aim of returning to the resistance at 1.2565. Breaking and testing this range from top to bottom against the backdrop of poor statistics - a chance for GBP/USD to rise with an update to 1.2610. If it breaks above this range, we can talk about a surge to 1.2657, where I plan to take profit. In the scenario of a decline in GBP/USD and the absence of buyers at 1.2532 in the second half of the day, the market will maintain balance. In this case, I will look for purchases around 1.2503. The formation of a false breakout will be a suitable option for entering the market. I plan to open long positions on GBP/USD immediately on the rebound from 1.2467, with a target of a correction of 30-35 points within the day.
For opening short positions on GBP/USD, the following is required:
Bears still have decent chances to continue the pair's decline, but strong US statistics are needed for this, which will once again convince traders that inflation cannot be defeated there. The formation of a false breakout after the reports come out around 1.2565 will be the ideal scenario for entering short positions, which will lead to a decline in GBP/USD to around 1.2532. Breaking and retesting this range from bottom to top will increase pressure on the pair, giving bears an advantage and another selling point with the goal of updating 1.2503. Testing this level will put buyers in a very dangerous position. The ultimate target will be the minimum at 1.2467, where I will take profit. In the scenario of GBP/USD growth and the absence of bears at 1.2565 in the second half of the day, bulls will have the opportunity to update the weekly high with an upward movement to the resistance at 1.2610. I will also sell there only on a false breakout. If there is no activity there, I recommend opening short positions on GBP/USD from 1.2657 in anticipation of the pair's downward rebound by 30-35 points within the day.

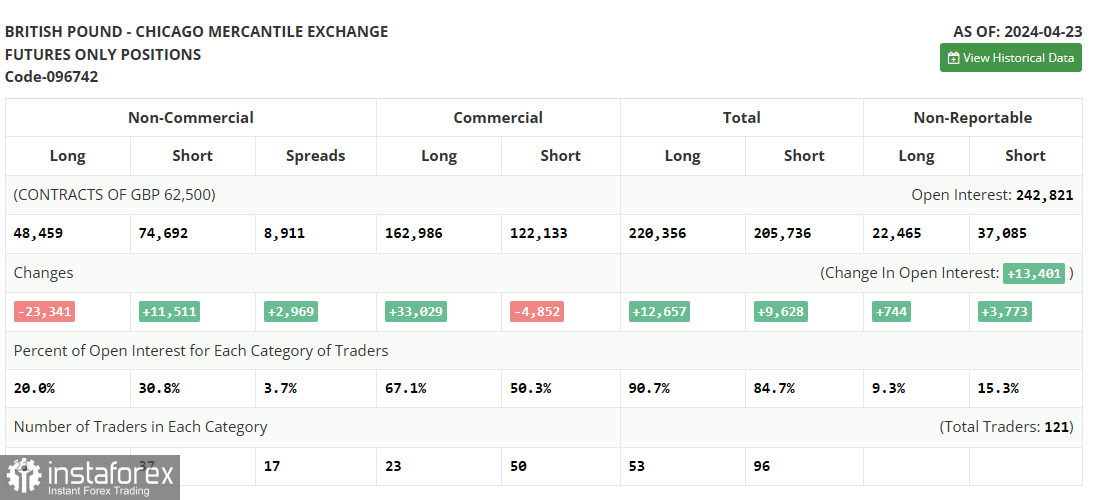
In the COT report (Commitment of Traders) for April 23, there was again a sharp reduction in long positions and an increase in short ones. Pound buyers continue to exit the market, as recent statistics from the UK have not pleased traders, and the risks of the US Federal Reserve announcing the need for further inflation control force traders to buy the US dollar again. Soon, there will be a meeting of the monetary policy committee, which will determine the further medium-term direction of the pair, so the current upward correction in the pound may quickly come to an end. The latest COT report states that long non-commercial positions decreased by 23,341 to 48,459, while short non-commercial positions increased by 11,511 to 74,692. As a result, the spread between long and short positions increased by 2,969.

Indicator Signals:
Moving Averages
Trading is conducted above the 30 and 50-day moving averages, indicating further pound growth.
Note: The period and prices of the moving averages are considered by the author on the hourly chart H1 and differ from the general definition of classical daily moving averages on the daily chart D1.
Bollinger Bands
In the event of a decline, the lower boundary of the indicator at around 1.2503 will act as support.
Description of Indicators:
• Moving Average (determines the current trend by smoothing out volatility and noise). Period 50. Marked in yellow on the chart.
• Moving Average (determines the current trend by smoothing out volatility and noise). Period 30. Marked in green on the chart.
• MACD Indicator (Moving Average Convergence/Divergence) Fast EMA period 12. Slow EMA period 26. SMA period 9.
• Bollinger Bands. Period 20.
• Non-commercial traders - speculators, such as individual traders, hedge funds, and large institutions using the futures market for speculative purposes and meeting certain requirements.
• Long non-commercial positions represent the total long open position of non-commercial traders.
• Short non-commercial positions represent the total short open position of non-commercial traders.
• The total non-commercial net position is the difference between the short and long positions of non-commercial traders.


