EUR/USD

Higher Timeframes
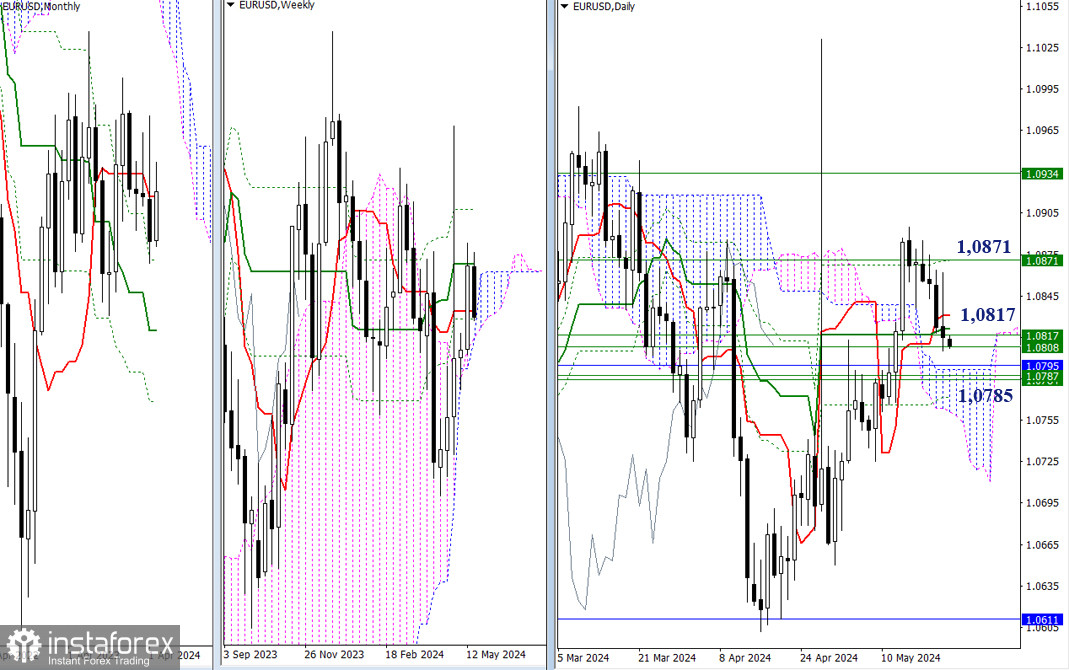
The bears are trying to extend the downward movement. Since they encountered a wide support area, they started testing it. In order to strengthen the bearish bias under current conditions, sellers need to overcome 1.0817 - 1.0808 - 1.0795 - 1.0785 and go beyond the daily and weekly Ichimoku clouds, consolidating in the bearish zone relative to the clouds. The weekly medium-term trend that was left behind (1.0871) currently serves as resistance and the nearest target in case the bulls recover their positions.

H4 – H1
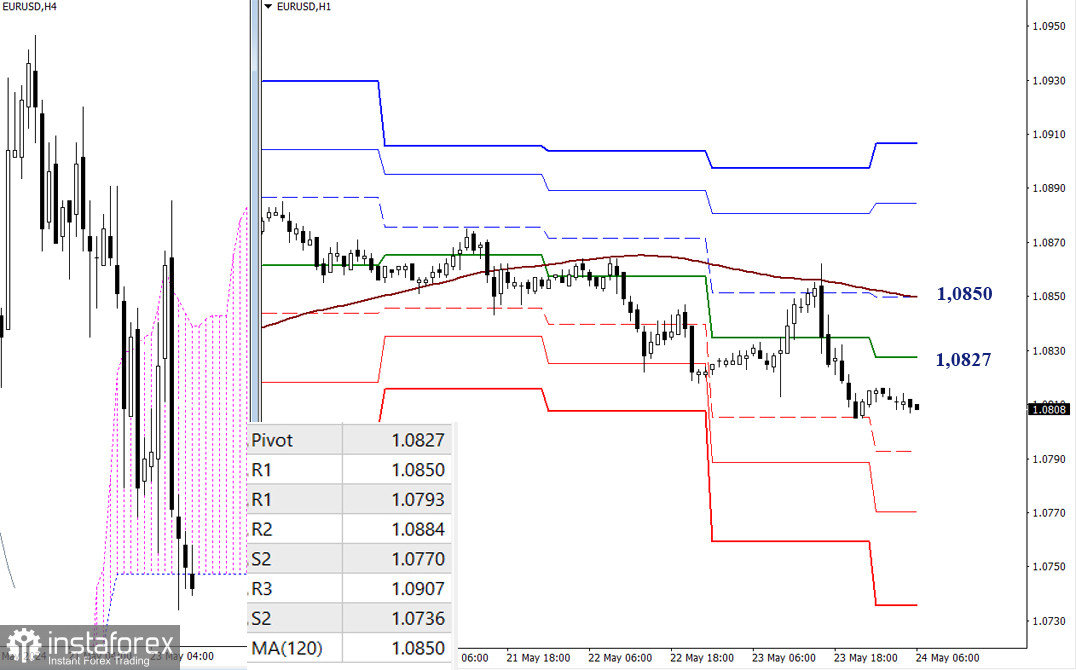
On the lower timeframes, the weekly long-term trend managed to accomplish its task yesterday, so the bears still have the advantage. The bearish bias can be improved further through testing and overcoming supports of classic Pivot levels (1.0793 - 1.0770 - 1.0736). Today's key levels can be found at 1.0827 - 1.0850 (central Pivot level + weekly long-term trend). A breakout and consolidation above these marks will affect the current balance of power, so the bulls can still gain the upperhand. In this case, the next bullish targets will be 1.0884 - 1.0907 (resistance of classic Pivot levels).
***
GBP/USD

Higher Timeframes
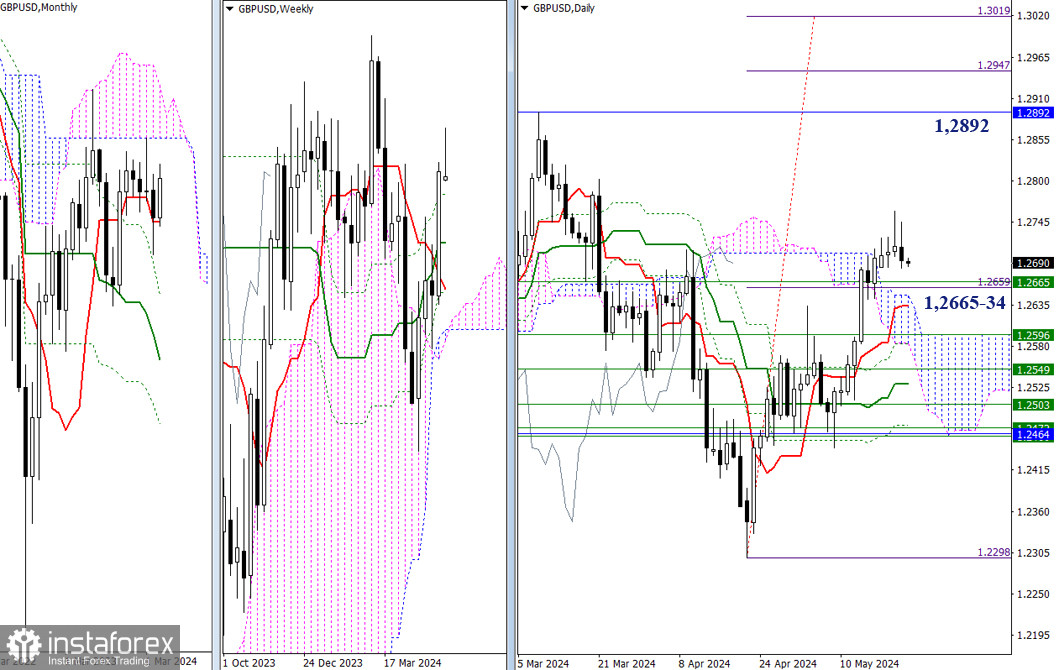
Yesterday, the bulls were unable to surpass the previous day's high, forming a candle with a bearish sentiment. Today, we can confirm this sentiment on the weekly candle. If the price continues to fall, the nearest supports are at 1.2665 – 1.2648 – 1.2634 (levels of the daily and weekly Ichimoku). Sustaining a bearish bias on the weekly timeframe could mean that this trend will persist on the monthly timeframe as well.

H4 – H1
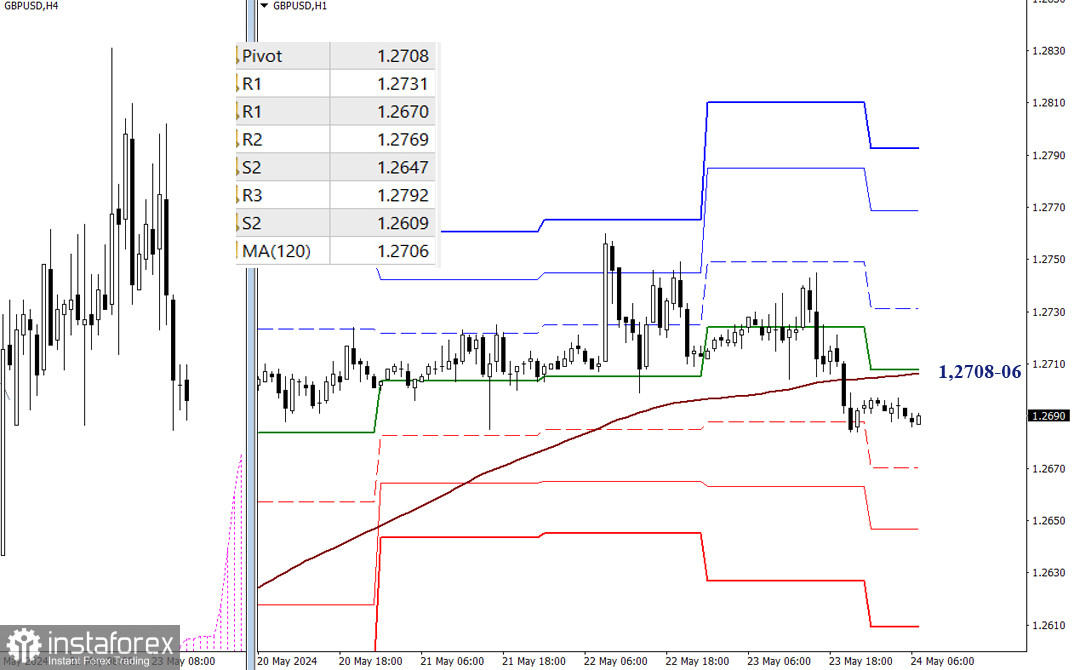
On the lower timeframes, the bears have now moved below and consolidated under key levels. As a result, the bears have the advantage. To build on the bearish sentiment, a decline must be realized by testing and breaking through the supports of the classical Pivot levels, which are located at 1.2670 – 1.2647 – 1.2609. It is very easy to lose the current advantage since the market hasn't moved far from the key levels. Rising and consolidating above the key levels of 1.2708-06 (central Pivot level + weekly long-term trend) will push the balance of power back to the bulls' side, and it is possible to strengthen positions by breaching the resistances of the classical Pivot levels (1.2731 – 1.2769 – 1.2792).
***
The technical analysis of the situation uses:
Higher timeframes - Ichimoku Kinko Hyo (9.26.52) + Fibonacci Kijun levels
Lower timeframes - H1 - Pivot Points (classic) + Moving Average 120 (weekly long-term trend)


