


EUR/USD
Higher timeframes
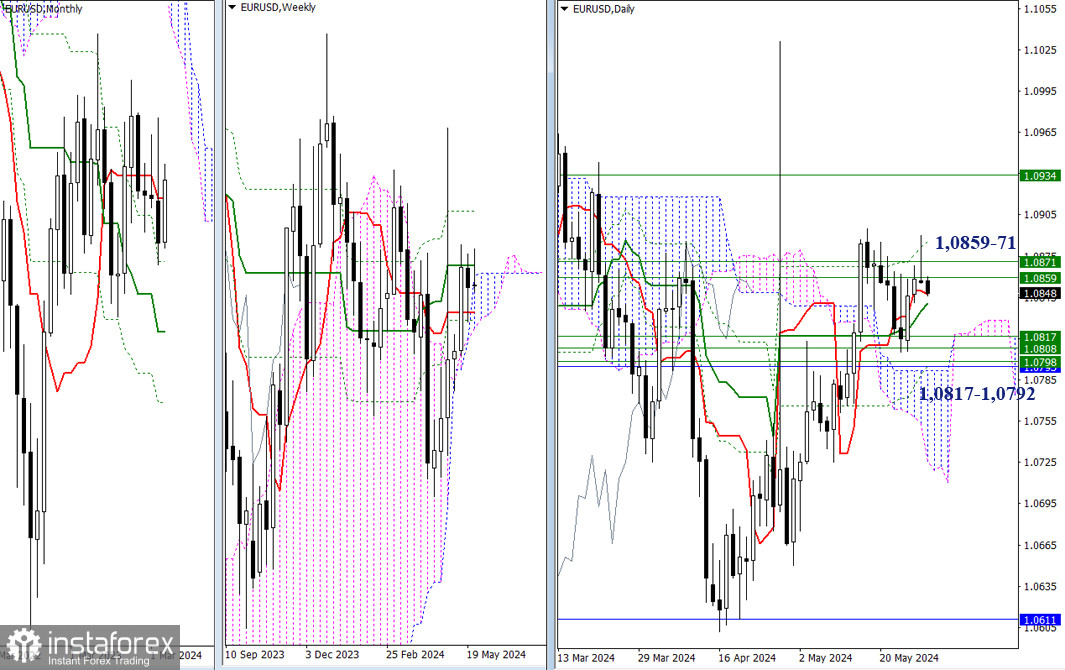
The bulls faced yet another setback. Yesterday, they failed to update the pair's high (1.0895) and move beyond the weekly resistances (1.0859 - 1.0871). As a result, EUR/USD bounced downwards. To confirm and work on this today, it is necessary to overcome the influence of the main levels of the daily cross at 1.0848 - 1.0840 (Tenkan + Kijun). After this, the next challenge will be interacting with a solid support area, which includes several strong levels from higher timeframes within a narrow range (1.0817 - 1.0792).
H4 – H1
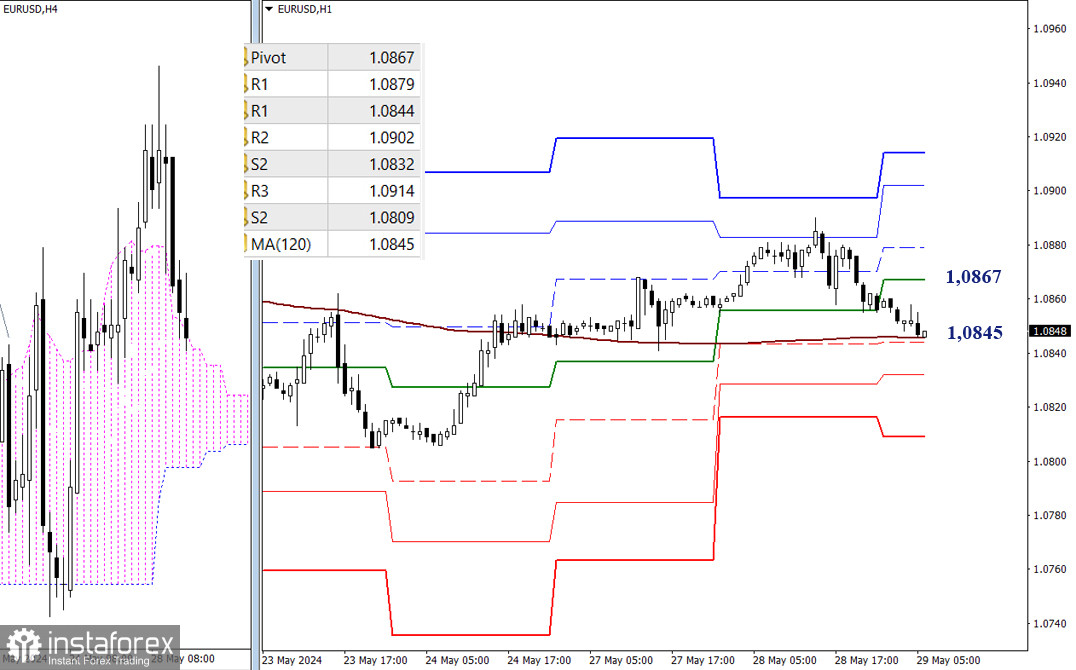
On the lower timeframes, the bearish correction has led to a test of the weekly long-term trend (1.0845). Breaking through this level could change the current balance of power. The next bearish targets after the intraday break will be the classic Pivot levels (1.0844 - 1.0832 - 1.0809). In case of a rebound from the weekly long-term trend, the focus will shift to recovering lost positions, and the market will concentrate on the resistance levels of the classic Pivot points. Currently, these resistances are located at 1.0867 - 1.0879 - 1.0902 - 1.0914.
***
GBP/USD
Higher Timeframes
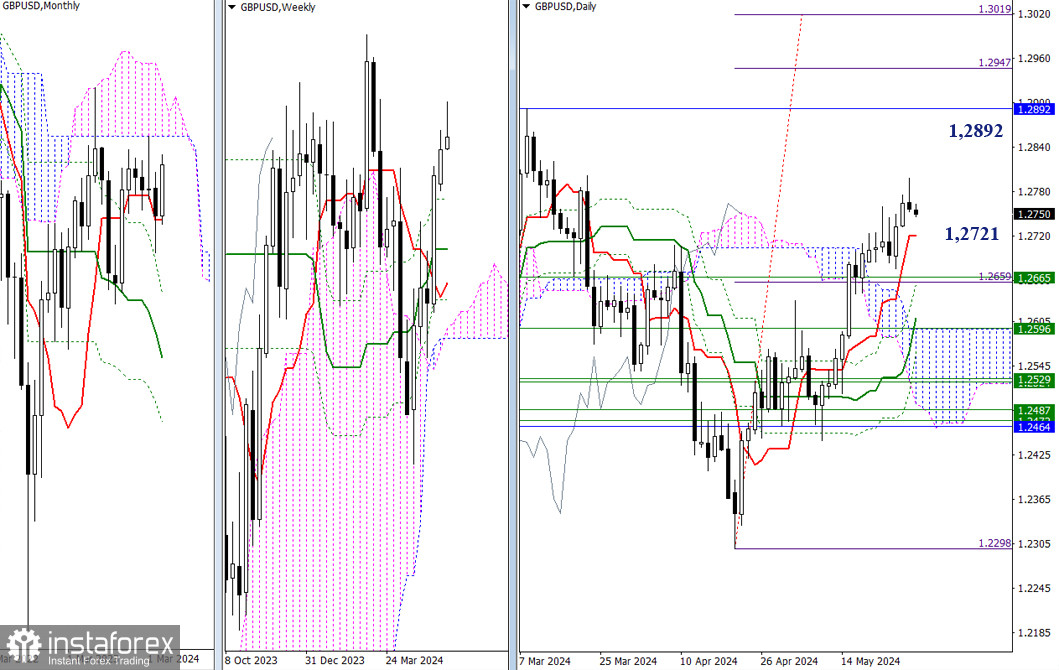
Yesterday, the bulls ended the day with the price gradually moving downwards. If it continues to decline, the market will encounter support levels at 1.2721 (daily short-term trend) and 1.2665 (weekly Fibo Kijun). However, if the bears fail to change the situation and the bulls overcome the slowdown, GBP/USD could rise, with bullish targets at 1.2892 (lower boundary of the monthly cloud) and 1.2947 – 1.3019 (daily target for breaking the cloud).
H4 – H1
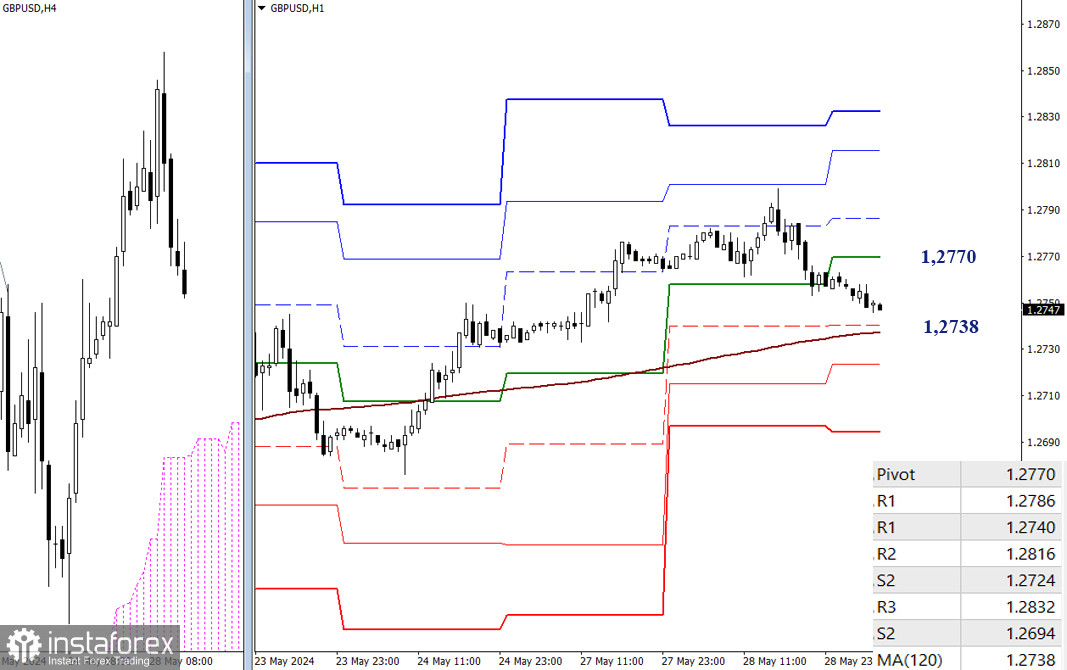
A correction is currently developing on the lower timeframes. The market is approaching a key level – the weekly long-term trend at 1.2738, which determines the current balance of power. Its outcome could set the course for further development. A rebound would shift the focus to the resistance levels of the classic Pivot points, which are located at 1.2770, 1.2786, 1.2816, and 1.2832. Conversely, a breakthrough would place the focus on the support levels of the classic Pivot points at 1.2724 and 1.2694.
***
The technical analysis of the situation uses:
Higher timeframes - Ichimoku Kinko Hyo (9.26.52) + Fibonacci Kijun levels
Lower timeframes - H1 - Pivot Points (classic) + Moving Average 120 (weekly long-term trend)


