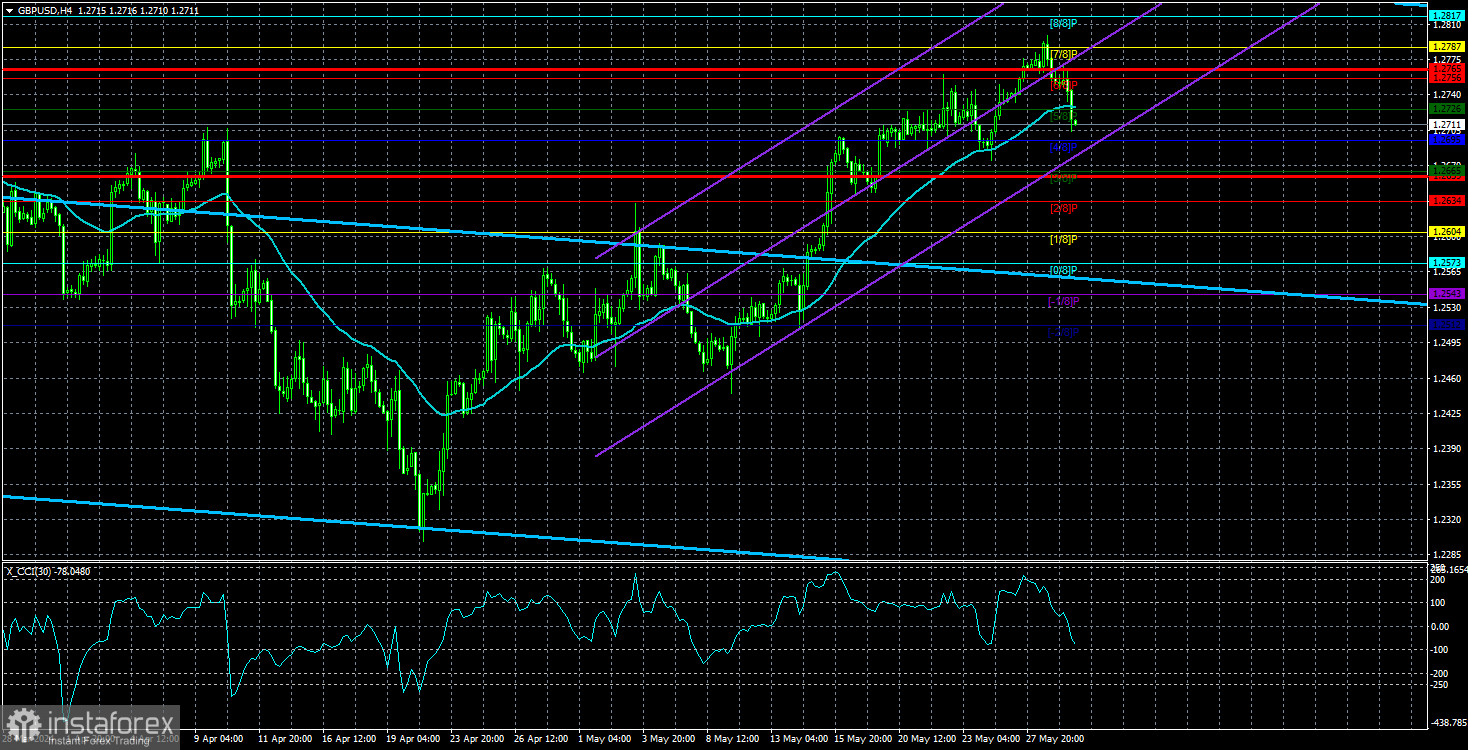
GBP/USD continued its corrective movement on Wednesday after bouncing off the Murray level "7/8" of 1.2787. As we have mentioned before, the British pound is extremely overbought and unreasonably expensive. Over the past few days, the British currency has been rising without any valid reasons. Unfortunately, this is what we usually see at the moment. We have to accept this fact and try to make profit from what we have.
So what are the options at the moment? The first option is to ignore the fundamental and macroeconomic background. You can open trades based on the most important reports and events, such as inflation or central bank meetings. Why? Because the market does not show a logical response to the majority of the macro data. Almost every report is interpreted in favor of the pound, which has long supported the pair. The same applies to fundamental events. Almost every day, representatives of the Federal Reserve speak, repeating the same thing: inflation is too high, and there are no plans for any rate cuts in the near future. At the same time, inflation in the UK has nearly dropped to the target level, making it possible for the Bank of England to start easing its monetary policy as early as June.
Of course, we are unlikely to see the first BoE rate cut in June. We believe that the central bank will be cautious and will not "jump the gun." Inflation in the UK has been excessively high for a long time, so it is possible that it will bounce back up in the coming months. However, hardly anyone will deny the fact that the BoE is much closer to easing than the Federal Reserve. Although earlier this year, the market believed the opposite.
However, all this data and information does not affect market sentiment at all. The British pound continues to trade in a way that is similar to Bitcoin, where the asset rises simply because it is being bought in hopes that it will rise further. The GBP/USD pair has already approached the Fibonacci level of 61.8%, around which it spent a lot of time in last year. If the movement we are currently observing is the start of a new uptrend, then it is extremely difficult for us to answer the question of what will support the pound for another 3-6-9 months or more? After all, a trend is not a local movement that can be driven solely by technical reasons. A trend is a prolonged movement of a pair that should have underlying reasons. If there are no reasons, then what will drive the pound to the upside?
However, the last six months (if not more) have shown us that a currency can rise even when all the factors point to its decline. Therefore, we came to the conclusion that technical analysis takes precedence. Of course, after one-and-a-half-month of rising, we expect the pound to fall anyway, at least within the framework of a correction. But now we could be talking about a correction, after which the unfounded uptrend will resume.

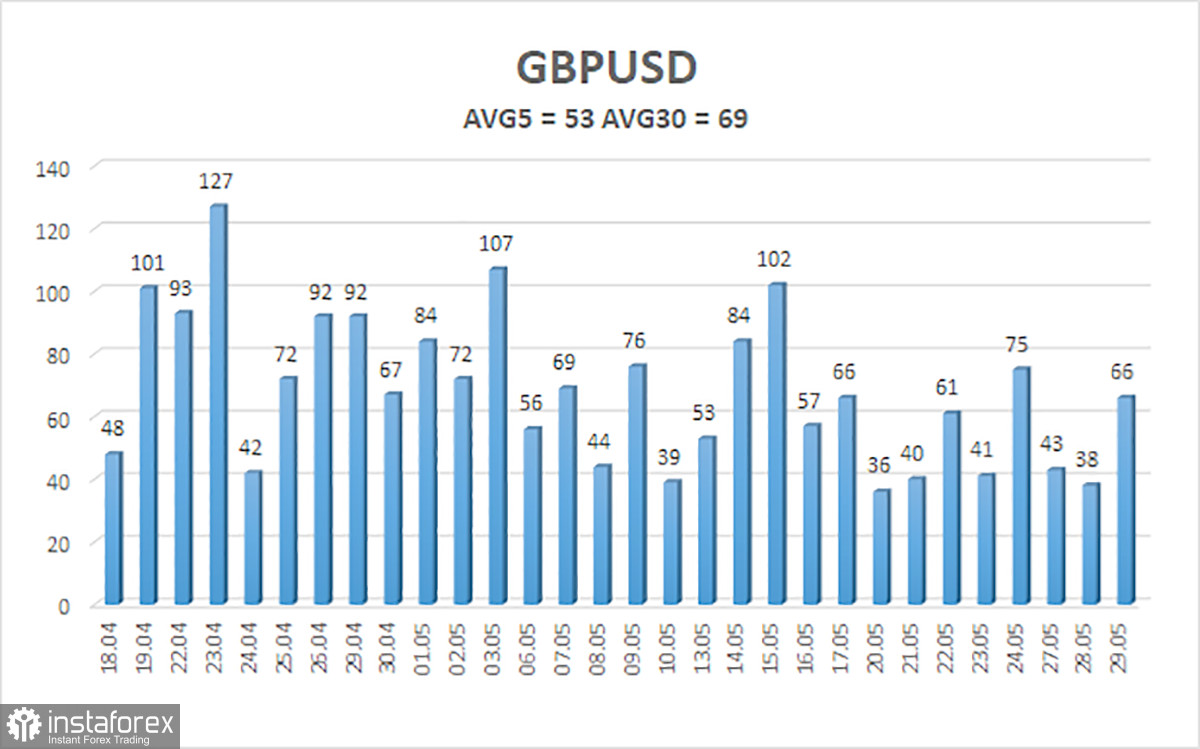
The average volatility of the GBP/USD pair over the last five trading days is 53 pips. This is considered a low value for the pair. Therefore, we expect the pair to trade within a range bounded by the levels of 1.2659 and 1.2765. The long-term linear regression channel is pointing downwards, suggesting a downward trend. The CCI indicator entered the oversold area three times in April, and the British currency surged. However, this correction should have ended a long time ago.
Nearest support levels:
S1 - 1.2695
S2 - 1.2634
S3 - 1.2604
Nearest resistance levels:
R1 - 1.2726
R2 - 1.2756
R3 - 1.2787
Trading Recommendations:
The GBP/USD pair has struggled to consolidate below the moving average. However, we still expect downward movement, but with the current paradoxical rise of the British currency, we may have to wait a long time. Yesterday's pullback does not necessarily imply the start of a new downtrend. Nonetheless, selling remains much more relevant, as the vast majority of factors point to the downside. Therefore, we can now consider selling with targets at 1.2665 and 1.2604. After a prolonged rise, the pound should at least correct lower a bit.
Explanation of Illustrations:
- Linear Regression Channels – Helps determine the current trend. If both are directed in the same direction, it means the trend is currently strong.
- Moving Average Line (settings 20.0, smoothed) – Determines the short-term trend and the direction in which trading should currently be conducted.
- Murray Levels – Target levels for movements and corrections.
- Volatility Levels (red lines) – The probable price channel in which the pair will spend the next day, based on current volatility indicators.
- CCI Indicator – Its entry into the oversold area (below -250) or the overbought area (above +250) means that a trend reversal in the opposite direction is imminent.


