EUR/USD

Higher timeframes
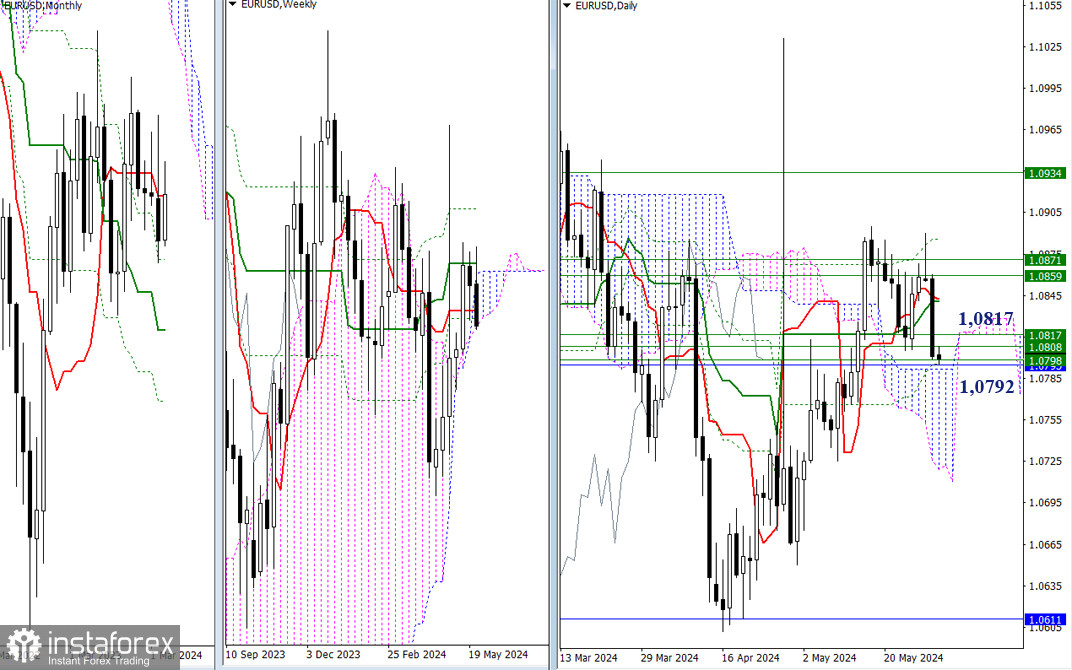
The intraday pullback, formed on Tuesday, was just confirmed yesterday. The bears, who are working on the situation, have returned to the support area (1.0817 – 1.0792), descending towards important support levels led by the monthly short-term trend (1.0795). A possible breakthrough and a reliable consolidation below this mark, aside from the monthly short-term trend shifting to the bears' side, will lead to a consolidation in the bearish territory relative to the weekly cloud. This will significantly strengthen the bearish bias and open up new prospects.

H4 – H1
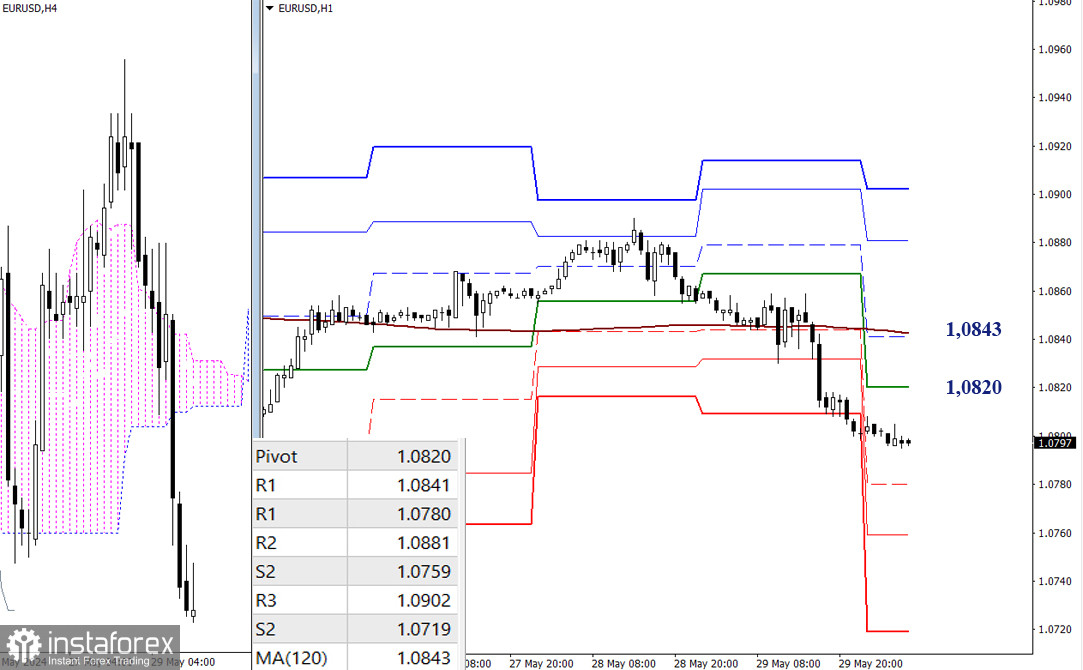
The bears currently have the upper hand. They are working on a decline, with intraday support targets being the classic Pivot levels, marked today at 1.0780 – 1.0759 – 1.0719. A change in sentiment, testing and breaking through the key levels of 1.0820 (central Pivot level) and 1.0843 (weekly long-term trend), will bring back opportunities to strengthen the bullish bias. In this case, the bullish targets will be the resistances of the classic Pivot levels.
***
GBP/USD

Higher Timeframes
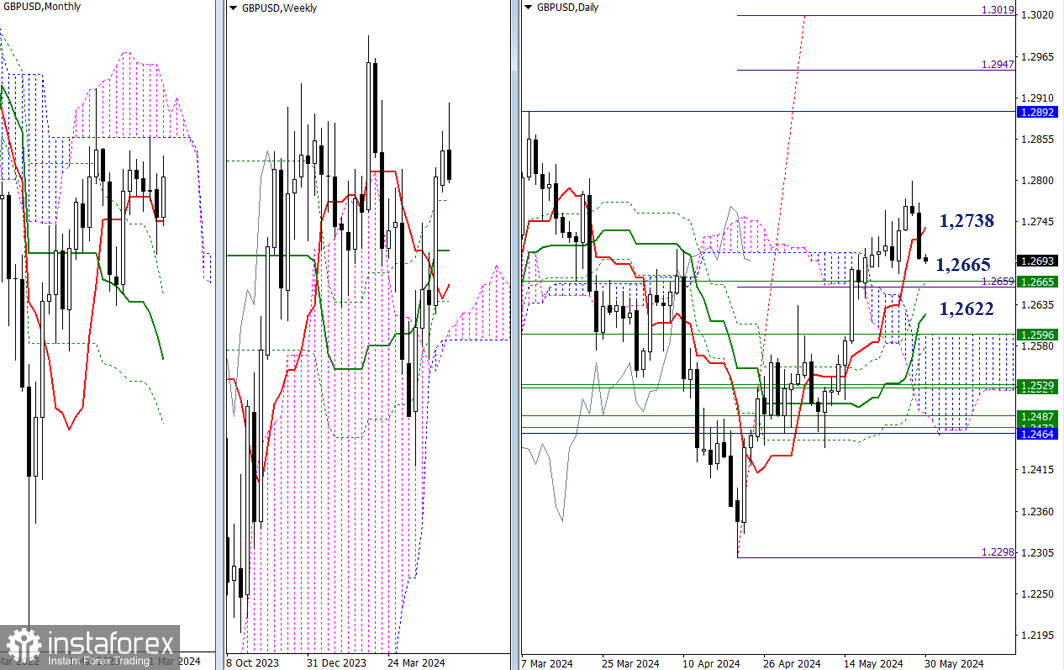
The pound, like the euro, demonstrated a bearish bias on Wednesday, and consolidated below the intraday short-term trend (1.2738), which currently acts as resistance and will be the first mark that the market encounters in case of a potential retest. The bears who are working on the downward movement will interact with nearby support levels. Today, the first support levels are located at 1.2665 (daily + weekly Fibonacci Kijuns) and 1.2622 (daily medium-term trend).

H4 – H1
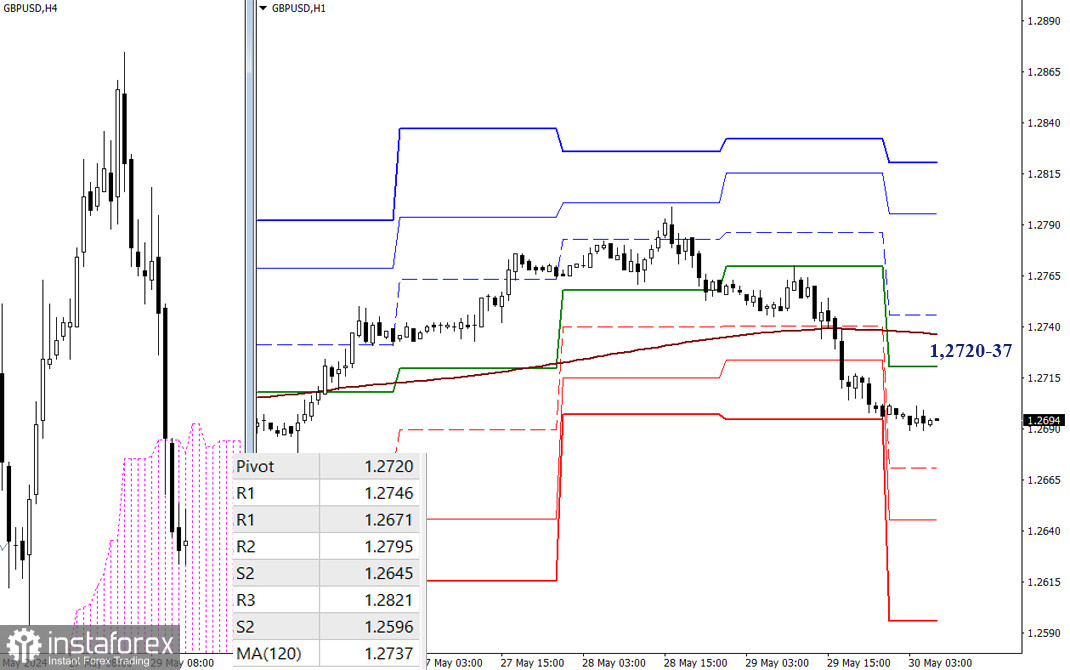
The bears currently have the advantage on the lower timeframes. In order to continue the decline, the bears will need to test and overcome the supports of the classic Pivot levels during the day (1.2671 – 1.2645 – 1.2596). The key levels are now forming resistances and, in the event of a corrective rise, traders will encounter them at 1.2720 (central Pivot level of the day) and 1.2737 (weekly long-term trend). After a breakout and trend reversal, the current balance of forces may change.
***
The technical analysis of the situation uses:
Higher timeframes - Ichimoku Kinko Hyo (9.26.52) + Fibonacci Kijun levels
Lower timeframes - H1 - Pivot Points (classic) + Moving Average 120 (weekly long-term trend)


