


USD/JPY
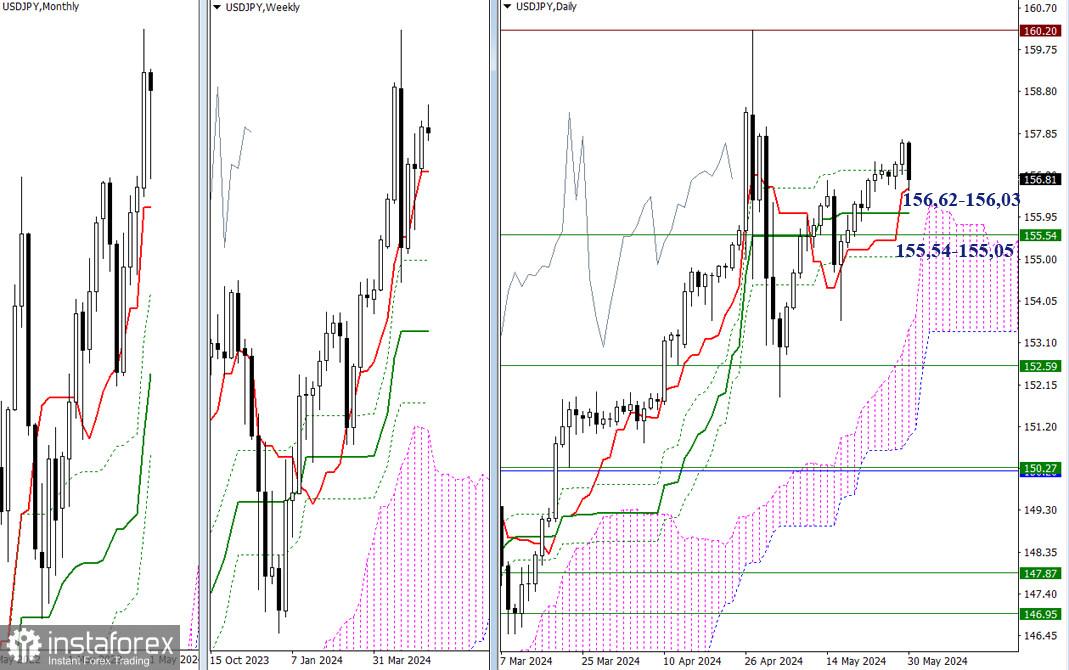
Higher Timeframes
The month of May is about to end. The pair is within reach of closing the month around its opening level. The bears are still unable to defend the levels they passed this month, but next month they may start another attempt to strengthen their positions and resume the decline. In this case, the supports of the intraday and weekly Ichimoku crosses' will become relevant again. These are currently the closest to the chart, located at 156.62, 156.03, 155.54, and 155.05. If the bears give up, the market will focus on testing the April high (160.20). New bullish prospects and opportunities will emerge after the price consolidates above this peak.
H4 – H1
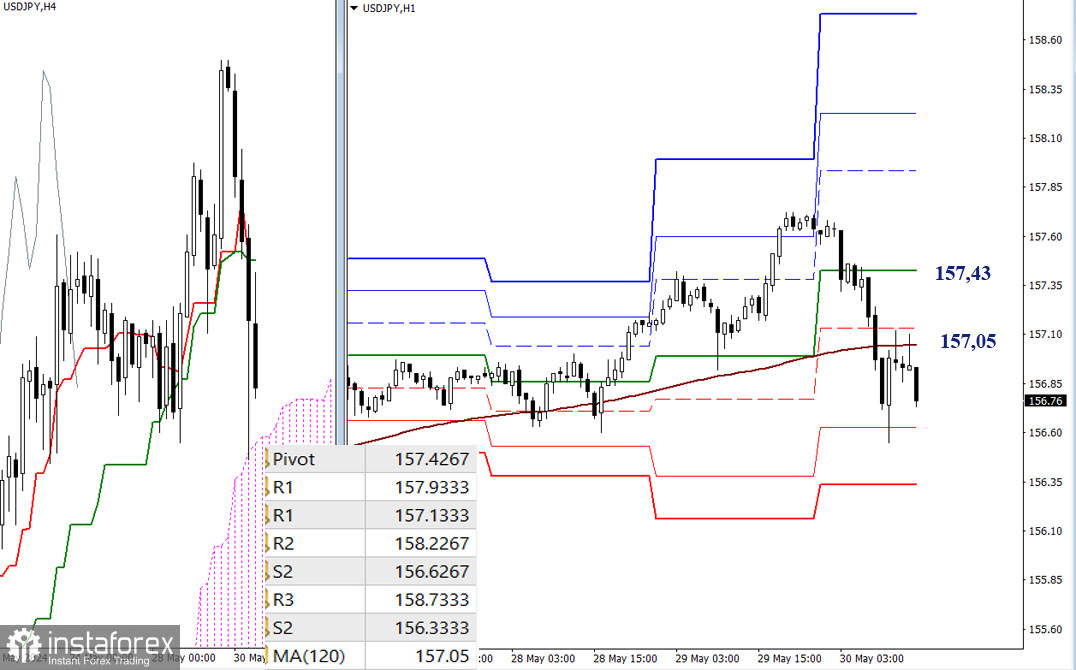
On the lower time frames, the bears managed to push the price below the weekly long-term trend (157.05), thereby gaining a significant advantage. If they can leave the area and influence the trend, the bears will continue to strengthen their position. The supports of the classic Pivot levels will be the intraday targets. Currently, there are two support levels on the bearish path that the price has not yet breached: 156.63 and 156.33. If priorities shift and the market returns to trading above the trend (157.05), then in order for the bulls to recover further, the focus should be on resistance of the classic Pivot levels (157.43, 157.93, 158.23, 158.73).
***
The technical analysis of the situation uses:
Higher timeframes - Ichimoku Kinko Hyo (9.26.52) + Fibonacci Kijun levels
Lower timeframes - H1 - Pivot Points (classic) + Moving Average 120 (weekly long-term trend)


