


GBP/USD started to rise again on Thursday. The pair settled below the moving average line on Wednesday, but the British pound did not even fall to the previous local low, which is only 120 pips below the last trough. Thus, after rising 500 pips, the GBP/USD pair cannot even correct by 120 pips. This is all you need to know about the current nature of the pair's movement.
There were no significant reports published in the UK, and there were no important events either. Yet, the British currency started to immediately rise. Therefore, the market simply started to open new long positions on the British pound out of nowhere. In the EUR/USD article, we mentioned that the euro's rise and the dollar's fall were not due to macro data from the US and the Eurozone. The same applies to the GBP/USD pair. The US dollar already started to fall early in the day.
The market continues to ignore the fundamental background, macroeconomic factors, and just plain common sense. We can't blame it for that. Average traders need to adapt to major players rather than trying to outplay or outsmart them. Therefore, traders should understand that the market is currently focused on buying the pound, and no reports or speeches can change its sentiment. In general, the fundamental and macroeconomic background are now useless.
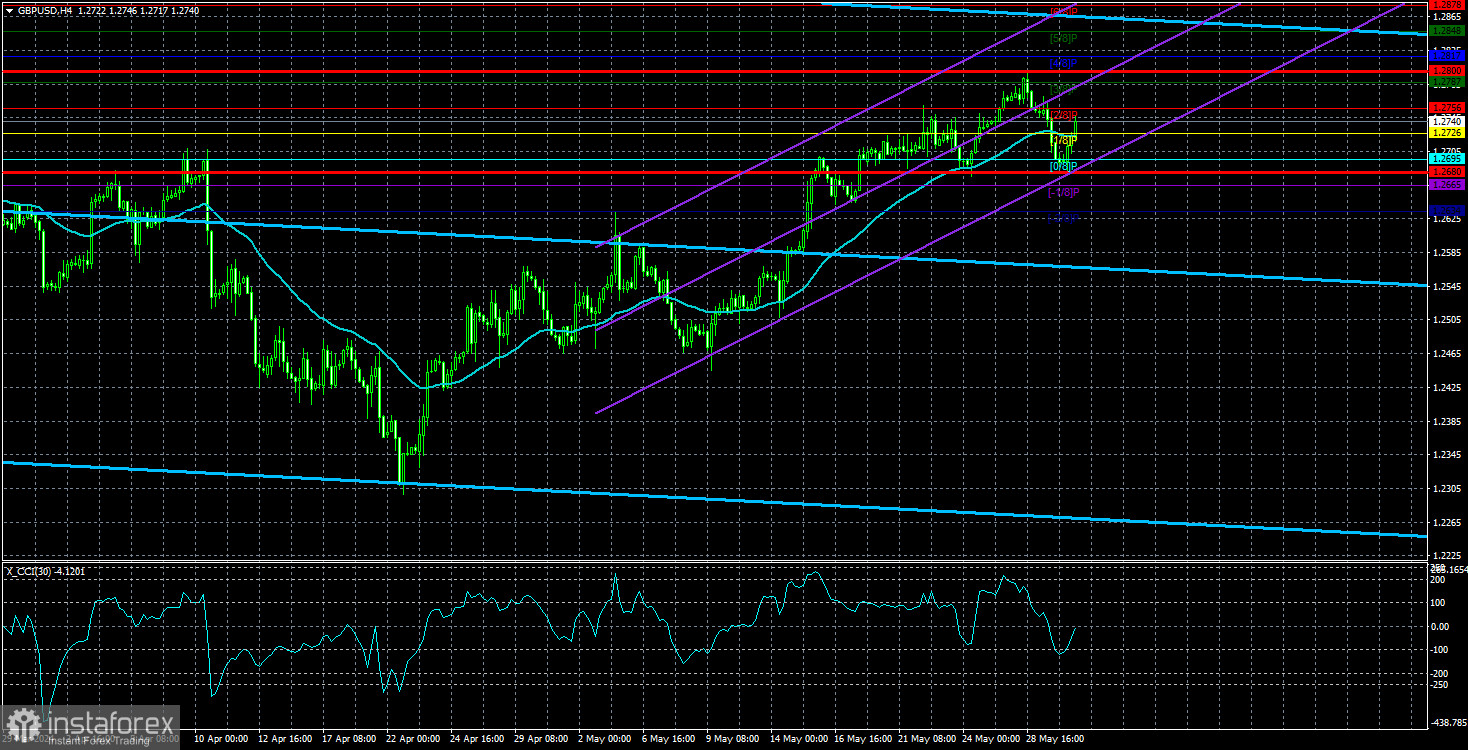
In regards to the technical picture, it's better not to look at the 24-hour timeframe. The chart is so chaotic that it's very difficult to understand the current trend. A couple of days ago, the price tested the important level of 1.2763 (61.8% on the Fibonacci retracement), where there's a very high probability of a bounce. However, how many similar resistance levels have we seen in the last month and a half? The price overcame all of them, and the British pound continues to rise against all odds.
We still hope that the market will go back to showing logical movements because it is morally and psychologically challenging to buy the British currency right now. However, the price can hardly settle below the moving average line on the 4-hour timeframe. It is tough to say what could push the pound higher for another six months or a year (if we are currently witnessing a new upward trend). The Bank of England will start lowering rates earlier than the Federal Reserve, and inflation in the US may force the Federal Reserve to maintain its monetary policy at the most hawkish level for a long time. However, market participants are not concerned about this at all. Currently, investors can only trade using technical analysis, and only on the 4-hour timeframe. Volatility remains low, as clearly indicated by the chart below. Volatility is not only low (just over 50 pips a day) but also decreasing over time, which is well illustrated by the diagram.
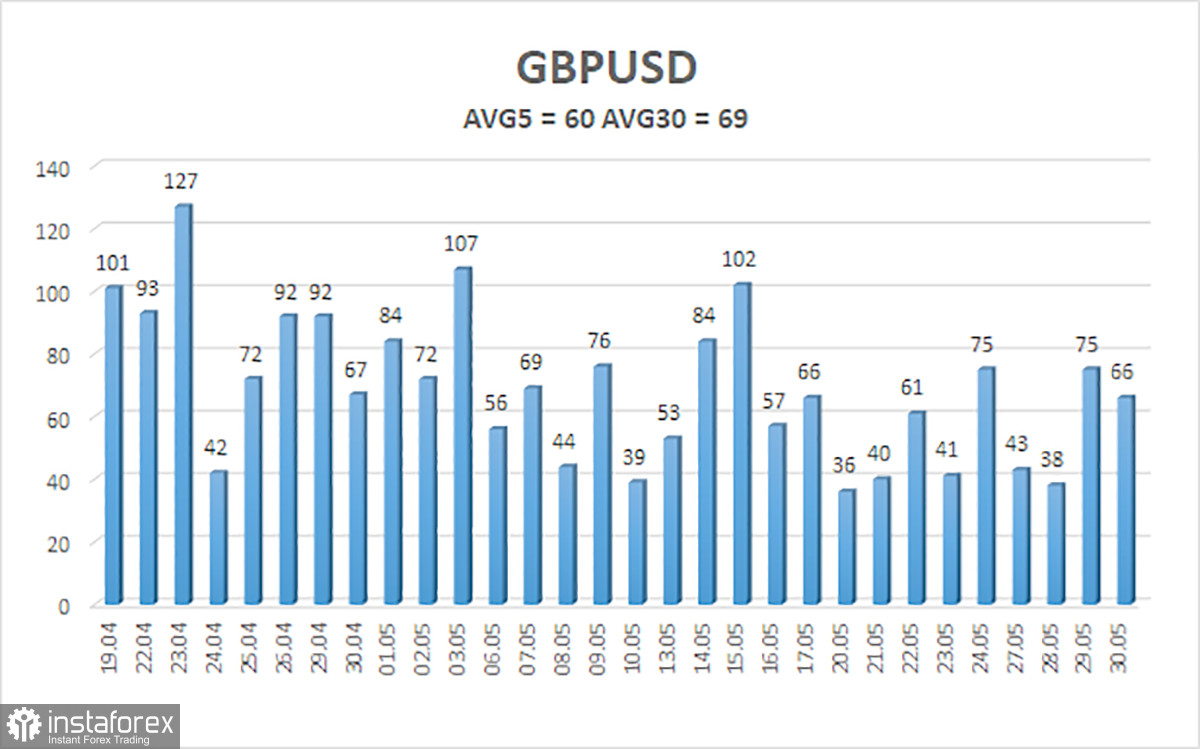
The average volatility of the GBP/USD pair over the last five trading days is 60 pips. Today, we expect GBP/USD to move within the range limited by the levels of 1.2680 and 1.2800. The higher linear regression channel is pointing downwards, suggesting a downward trend. The CCI indicator entered the oversold area three times in April, and the British currency started a new round of growth. However, this correction should have ended a long time ago.
Nearest support levels:
S1 - 1.2695
S2 - 1.2665
S3 - 1.2634
Nearest resistance levels:
R1 - 1.2726
R2 - 1.2756
R3 - 1.2787
Trading Recommendations:
The GBP/USD pair has struggled to consolidate below the moving average but, as it turned out, it didn't last for long. However, we still expect downward movement, but with the current paradoxical rise of the British currency, we may have to wait a long time. The pullback on Wednesday does not necessarily imply the start of a new downtrend. Selling remains much more relevant, as the vast majority of factors point to the downside. Therefore, we can now consider selling with targets at 1.2665 and 1.2604, but only after the price consolidates below the moving average once again. Traders may consider long positions above the moving average line if they decide to trade using technique.
Explanation of Illustrations:
- Linear Regression Channels – Helps determine the current trend. If both are directed in the same direction, it means the trend is currently strong.
- Moving Average Line (settings 20.0, smoothed) – Determines the short-term trend and the direction in which trading should currently be conducted.
- Murray Levels – Target levels for movements and corrections.
- Volatility Levels (red lines) – The probable price channel in which the pair will spend the next day, based on current volatility indicators.
- CCI Indicator – Its entry into the oversold area (below -250) or the overbought area (above +250) means that a trend reversal in the opposite direction is imminent.


