


Analyzing Thursday's trades:
EUR/USD on 1H chart
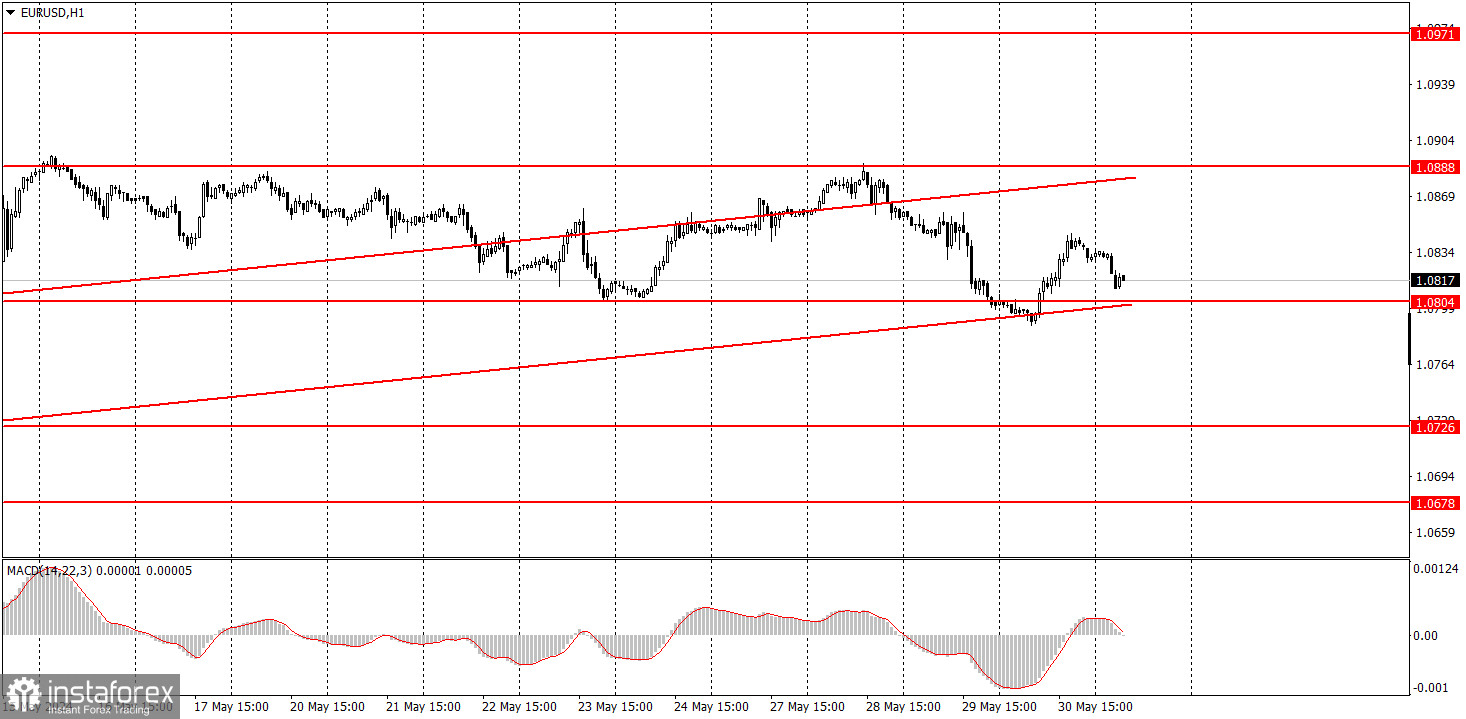
EUR/USD traded with clear positivity on Thursday. There were no fundamental or macroeconomic reasons behind the movement, but at the same time, we acknowledge the fact that the market had a right to buy the euro. Firstly, the price bounced from the lower boundary of the ascending channel, which already implied that the pair would rise. Secondly, the Eurozone unemployment rate decreased, which did not meet expert forecasts, meaning the euro could rise. Thirdly, Thursday's report showed that the US economy grew less than initially estimated in the first quarter – down to 1.3% in quarterly terms.
Why do we consider this an illogical rise? Because the euro has been rising for too long, it is overbought, and the fundamental background has often implied that the euro should fall. Therefore, we believe it was a purely technical rebound and the pair showed the same upward movement. Logically speaking, the euro should resume the downward movement.
EUR/USD on 5M chart
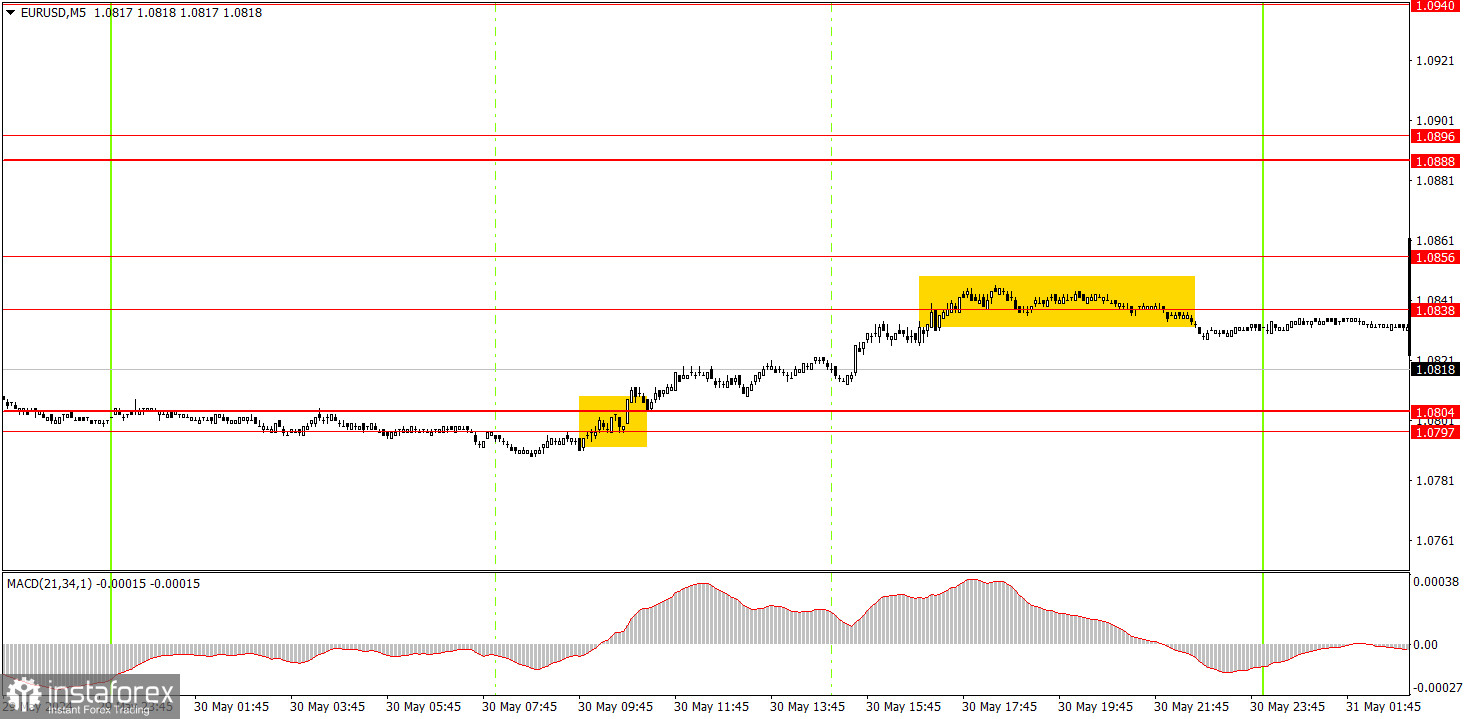
There was one very good buy signal on the 5-minute timeframe. At the start of the European trading session, the price consolidated above the 1.0797-1.0804 area, after which it managed to rise to the 1.0838-1.0856 area. Traders should have executed this signal with a long position. The profit was about 25-30 pips. Not much, but with the current volatility, such an amount of profit was quite significant. Furthermore, novice traders could consider short positions after the price rebounded from the 1.0838-1.0856 area.
Trading tips on Friday:
On the hourly chart, the bullish correction remains intact, which has intersected with a flat trend over the past two weeks. We believe that the euro should decline in the medium term, as the overall trend remains downward. Nevertheless, the market still refuses to buy the dollar for unknown reasons and volatility also remains low. A downward trend may form if the price consolidates below the ascending channel.
On Friday, novice traders may look for signals around the areas of 1.0797-1.0804 and 1.0838-1.0856. You may consider sell signals, but the euro could also rise at any moment. Consolidation below the ascending channel may suggest the end of the euro's rise.
The key levels on the 5M chart are 1.0483, 1.0526, 1.0568, 1.0611, 1.0678, 1.0726-1.0733, 1.0797-1.0804, 1.0838-1.0856, 1.0888-1.0896, 1.0940, 1.0971-1.0981. The main item on today's agenda will be the Eurozone inflation report. Traders may respond to this report during both the European and US trading sessions. In addition, Germany will release a retail sales report, and the US will publish the Personal Consumption Expenditures (PCE) Price Index.
Basic trading rules:
1) Signal strength is determined by the time taken for its formation (either a bounce or level breach). A shorter formation time indicates a stronger signal.
2) If two or more trades around a certain level are initiated based on false signals, subsequent signals from that level should be disregarded.
3) In a flat market, any currency pair can produce multiple false signals or none at all. In any case, the flat trend is not the best condition for trading.
4) Trading activities are confined between the onset of the European session and mid-way through the U.S. session, after which all open trades should be manually closed.
5) On the 30-minute timeframe, trades based on MACD signals are only advisable amidst substantial volatility and an established trend, confirmed either by a trendline or trend channel.
6) If two levels lie closely together (ranging from 5 to 15 pips apart), they should be considered as a support or resistance zone.
How to read charts:
Support and Resistance price levels can serve as targets when buying or selling. You can place Take Profit levels near them.
Red lines represent channels or trend lines, depicting the current market trend and indicating the preferable trading direction.
The MACD(14,22,3) indicator, encompassing both the histogram and signal line, acts as an auxiliary tool and can also be used as a signal source.
Significant speeches and reports (always noted in the news calendar) can profoundly influence the price dynamics. Hence, trading during their release calls for heightened caution. It may be reasonable to exit the market to prevent abrupt price reversals against the prevailing trend.
Beginning traders should always remember that not every trade will yield profit. Establishing a clear strategy coupled with sound money management is the cornerstone of sustained trading success.


