


EUR/USD
Higher timeframes
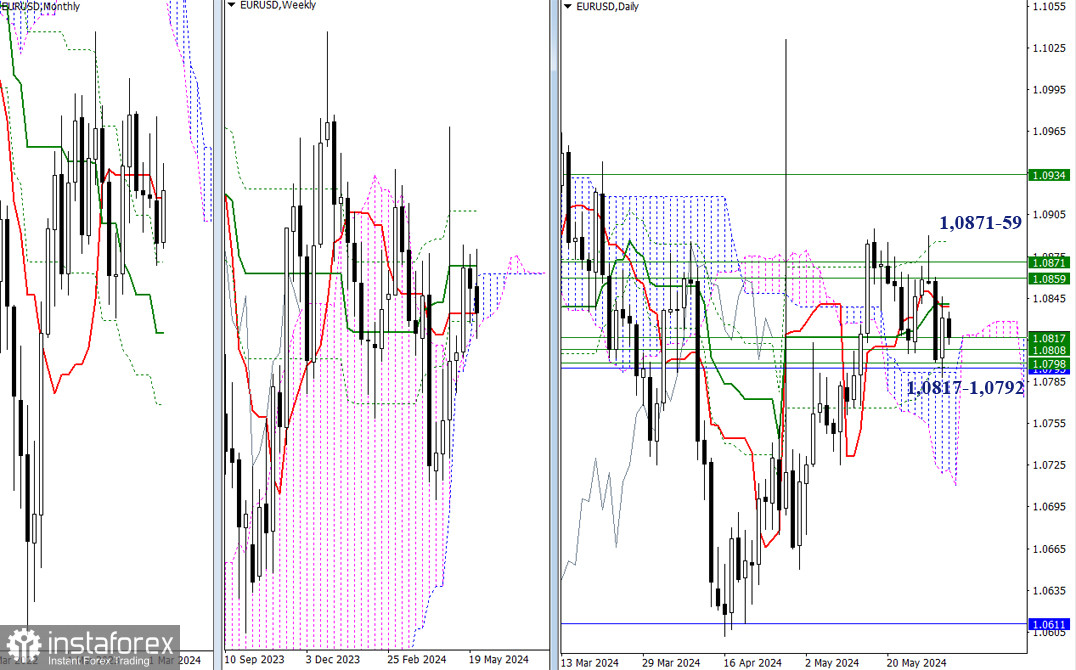
As May is about to come to an end, the market is currently dominated by uncertainty, with boundaries defined by clusters of levels from various time intervals: 1.0885-71-59 and 1.0817-08 – 1.0796-92. If EUR/USD shows significant activity today and someone decides to make a move at the end of the month, more distant levels could come into play, such as the final level of the weekly Ichimoku dead cross (1.0934) or the lower boundary of the daily cloud (1.0722).
H4 – H1
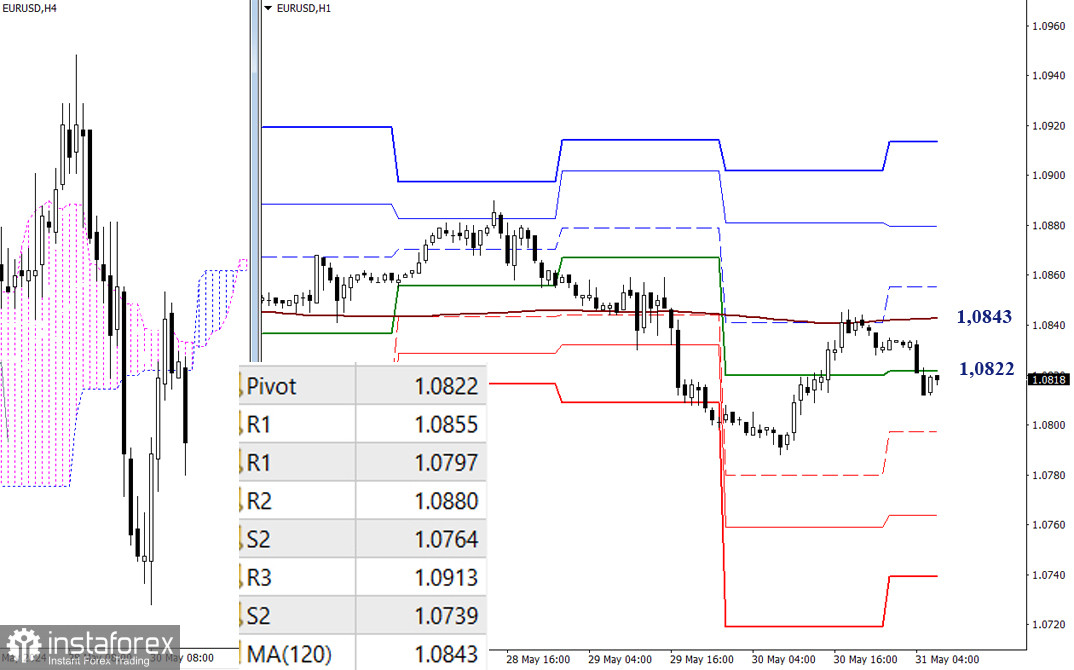
On the lower timeframes, the pair continues to trade below key levels, which are located at 1.0822 (the central Pivot level of the day) and 1.0843 (the weekly long-term trend). Currently, these levels have become almost horizontal, which shows that there is no specific direction. The bears can maintain the upper hand if the pair trades below the key levels. The intraday bearish targets are the classic Pivot levels at 1.0797 – 1.0764 – 1.0739. A breakout and keeping the price above the trend will shift the current balance of power in favor of the bulls. The bullish targets will be the resistances of the classic Pivot levels at 1.0855 – 1.0880 – 1.0913.
***
GBP/USD
Higher Timeframes
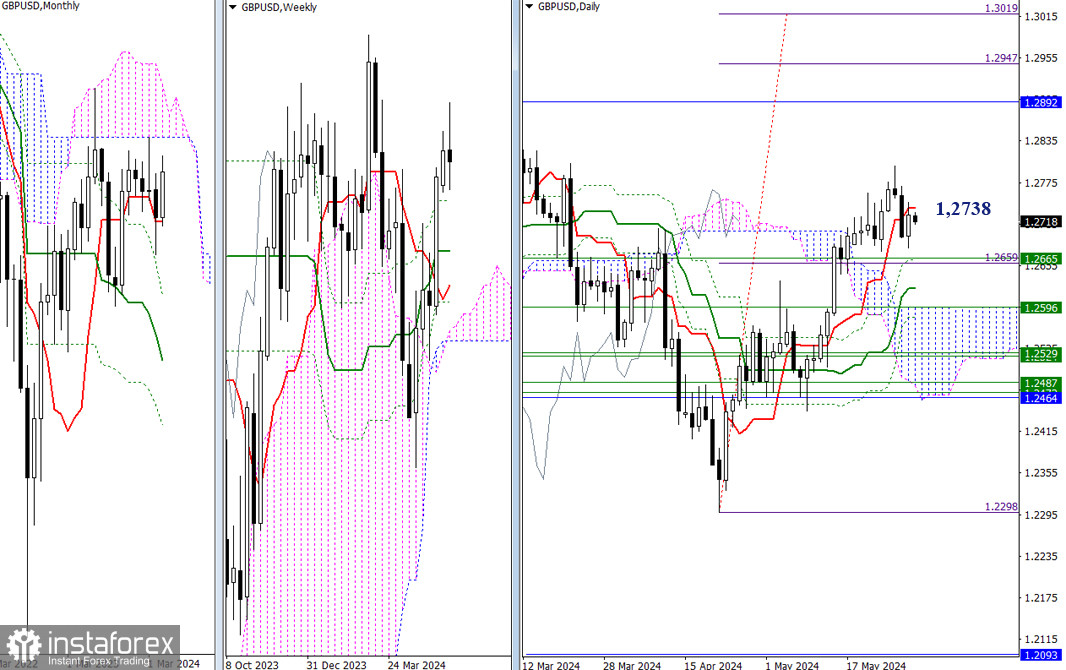
The daily short-term trend (1.2738) currently acts as the center. Today, both the weekly and monthly results are in focus, though on a monthly scale, the situation is progressing within a consolidation zone, and it is unlikely for the price to move beyond its bounds during the month of May. Nonetheless, the general mood and direction could support the activity in April. The nearest bullish target is the resistance of the lower boundary of the monthly cloud (1.2892). Bearish targets are represented by supports on the daily and weekly timeframes, with the nearest level being at 1.2665 (weekly and monthly Fibo Kijun levels).
H4 – H1
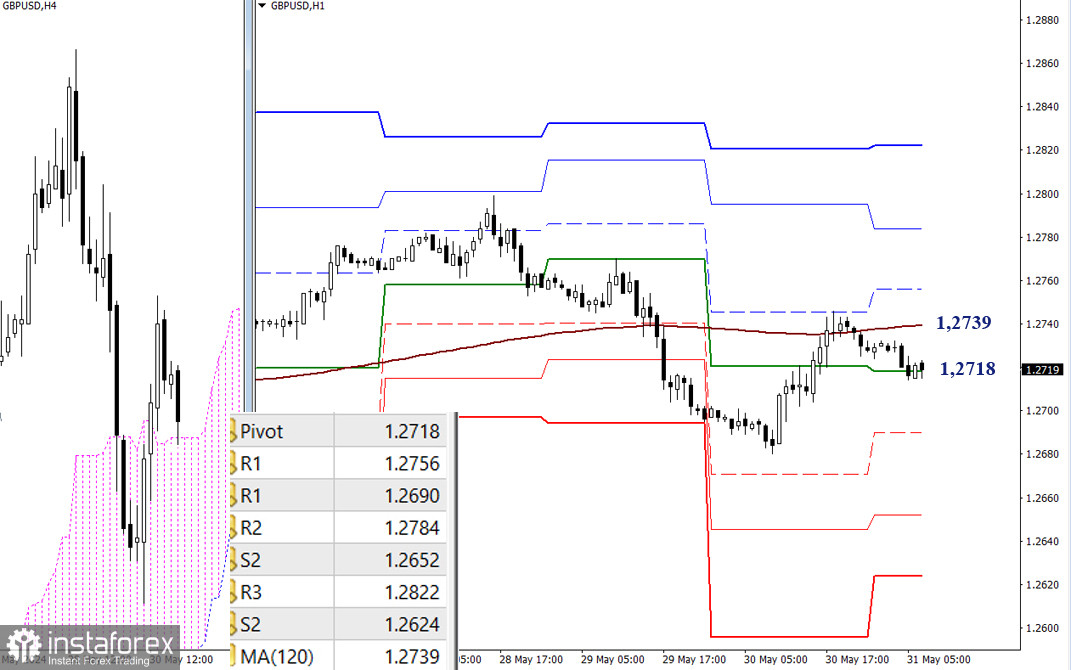
Uncertainty dominates on the lower timeframes. The weekly long-term trend holds a horizontal position (1.2739). We can take note of some advantages based on the price's position relative to the trend. The bears currently have the advantage, as the pair is trading below the trend. Intraday bearish targets are the supports of the classic Pivot levels (1.2690 – 1.2652 – 1.2624). Consolidation above the trend will shift focus to the resistances of the classic Pivot levels (1.2756 – 1.2784 – 1.2822).
***
The technical analysis of the situation uses:
Higher timeframes - Ichimoku Kinko Hyo (9.26.52) + Fibonacci Kijun levels
Lower timeframes - H1 - Pivot Points (classic) + Moving Average 120 (weekly long-term trend)


