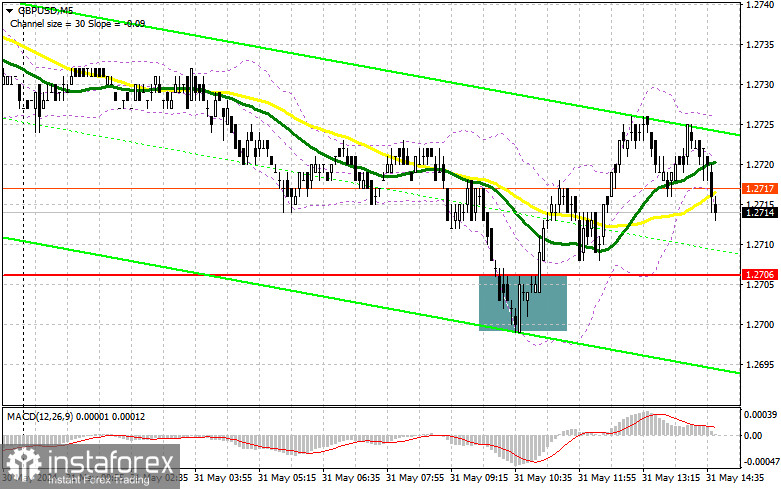
In my morning forecast, I paid attention to the level of 1.2706 and planned to enter the market from it. Let's look at the 5-minute chart and figure out what happened there. The decline and the formation of a false breakout led to a signal to buy the pound, which resulted in an increase of more than 20 points at the time of writing. In the afternoon, the technical picture was slightly revised.

To open long positions on GBP/USD, you need:
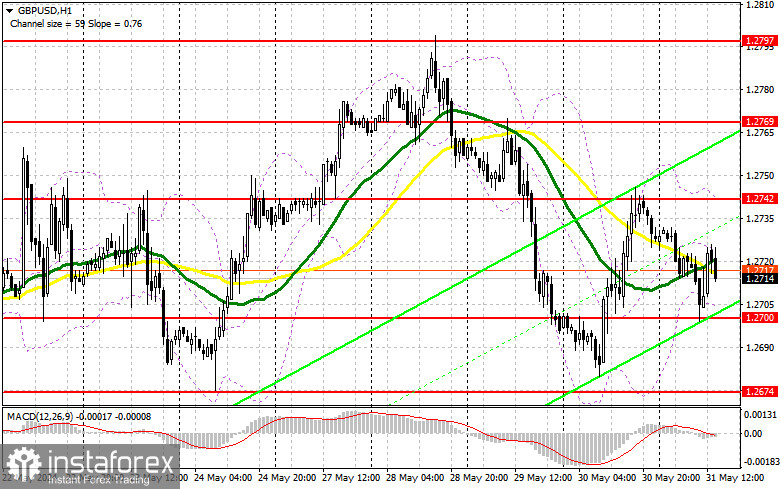
Data on lending in the UK put pressure on the pound, but buyers coped with it. Now, all the attention will be focused on the US data. The main index of personal consumption expenditures will determine the dollar's direction at the end of the week. In addition, figures are being released on changes in the population's income level and the level of spending of the US population. Strong indicators will drop a couple back to the 1.2700 area, where I expect buyers to show up. Forming a false breakout there will allow you to get a good entry point into long positions, capable of growth to 1.2742. A rush and a top-down test of this range against the background of news about falling personal consumption expenditures in the United States will give a chance for GBP/USD growth with the 1.2769 update. In the case of an exit above this range, we can talk about a breakthrough to 1.2797, where I will fix profits. In the scenario of GBP/USD falling and no buyers at 1.2700 in the afternoon, the pressure on the pound will return, leading to a downward movement to the support area of 1.2674. Forming a false breakout will be a suitable option for entering the market. Opening long positions on GBP/USD immediately on a rebound from 1.2646 to correct 30-35 points within a day is possible.
To open short positions on GBP/USD, you need:
If the pair grows against the background of weak statistics, which is more likely, I will act only after forming a false breakdown in the resistance area of 1.2742, which we did not reach in the first half of the day. This will lead to an entry point into short positions to reduce GBP/USD to the 1.2700 support area formed during European trading. A breakout and a reverse test from the bottom up of this range will increase the pressure on the pair, giving the bears an advantage and another entry point to sell to update 1.2674, where I expect a more active manifestation of buyers. A longer-range target will be a minimum of 1.2646, which will indicate the formation of a new bearish trend. I will fix the profit there. With the option of GBP/USD growth and the absence of bears at 1.2742 in the afternoon, which is more likely, buyers will regain the initiative, having the opportunity to update 1.2769. I will also serve there only on a false breakdown. Without activity there, I advise you to open short positions on GBP/USD from 1.2797, counting on the pair's rebound down by 30-35 points within the day.
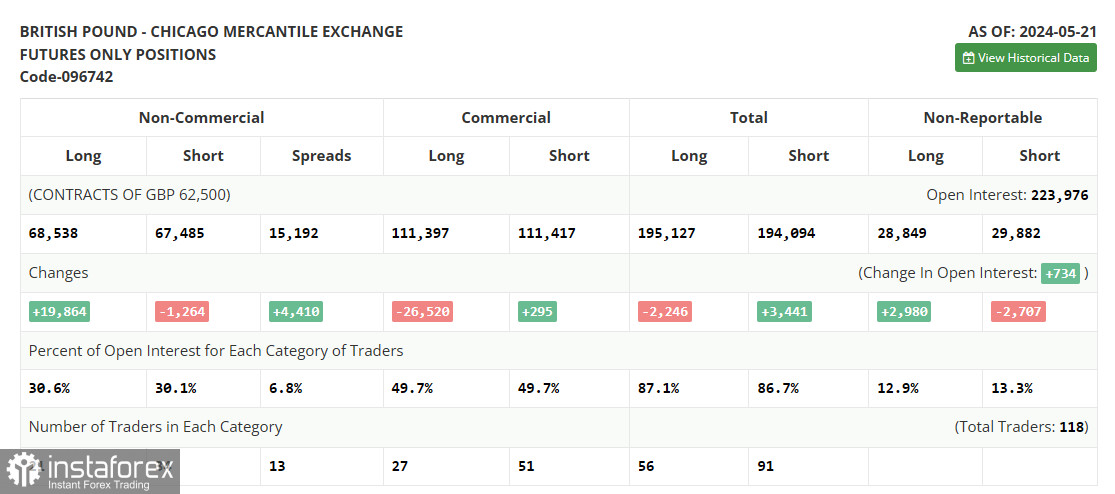
The COT report (Commitment of Traders) for May 21 showed a sharp increase in long and a reduction in short positions. Traders continue to believe that the Bank of England will cut interest rates by the end of summer or the beginning of autumn this year, providing good support to the UK economy. Recent inflation data have pointed to this possibility, but to complete the picture, the regulator wants to ensure that prices fall in all directions. The service sector remains a problem area, where prices are rising due to an increase in household wage growth. As soon as this component is put in order, there will be a reduction in rates, which will support the British pound and the UK economy in the medium term. The latest COT report says that long non-profit positions increased by 19,864 to 68,538, while short non-profit positions fell by 1,264 to 67,485. As a result, the spread between long and short positions increased by 2,109.

Indicator Signals:
Moving Averages:
Trading is conducted around the 30 and 50-day moving averages, indicating a sideways market.
Note: The author considers the period and prices of moving averages on the H1 hourly chart, which differs from the classical daily moving averages on the D1 daily chart.
Bollinger Bands:
In case of a decline, the lower boundary of the indicator, around 1.2700, will act as support.
Indicator Descriptions:
- Moving average (determines the current trend by smoothing volatility and noise). Period 50. Marked in yellow on the chart.
- Moving average (determines the current trend by smoothing volatility and noise). Period 30. Marked in green on the chart.
- MACD (Moving Average Convergence/Divergence — convergence/divergence of moving averages). Fast EMA period 12. Slow EMA period 26. SMA period 9.
- Bollinger Bands. Period 20.
- Non-commercial traders are speculators such as individual traders, hedge funds, and large institutions that use the futures market for speculative purposes and meet certain requirements.
- Long non-commercial positions represent the total long open position of non-commercial traders.
- Short non-commercial positions represent the total short open positions of non-commercial traders.
- Total non-commercial net position is the difference between short and long positions of non-commercial traders.


