


Analyzing Tuesday's trades:
GBP/USD on 1H chart
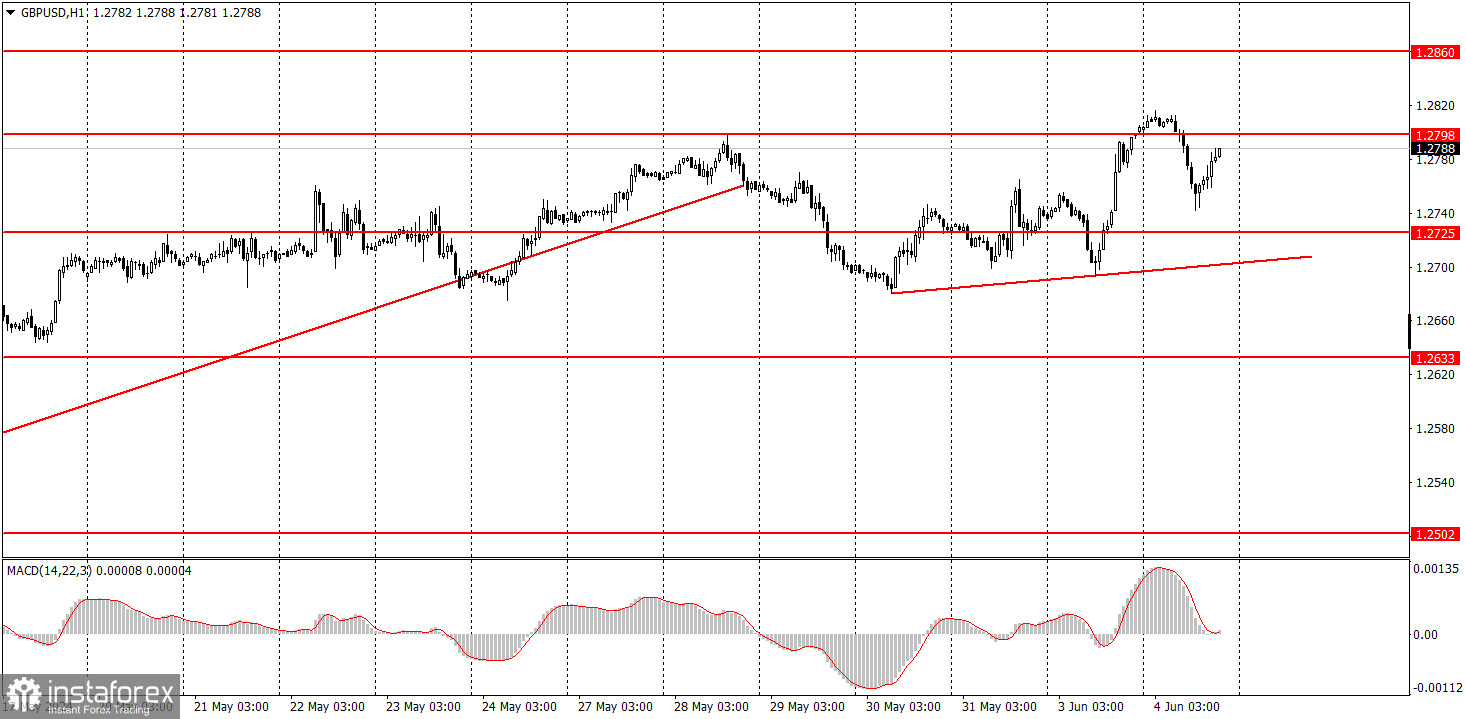
GBP/USD showed a minor downward movement on Tuesday, which is insignificant. The pair rose in the second half of the day as another US report – the JOLTs data – turned out weaker than forecasts. Simultaneously, a new ascending trend line was formed, the third or fourth in a row. Take note that previous ascending trend lines were broken at certain points, and... the pound, as if nothing had happened, resumed its upward movement. Therefore, even a consolidation below the trend line does not work at the moment.
The market buys the pound when there are particular macroeconomic reasons for it. Traders buy the pound even when there is no reason to do so. Market participants are not interested in the fundamental background. We have seen the same case for the GBP/USD pair in the first half of 2024.
GBP/USD on 5M chart
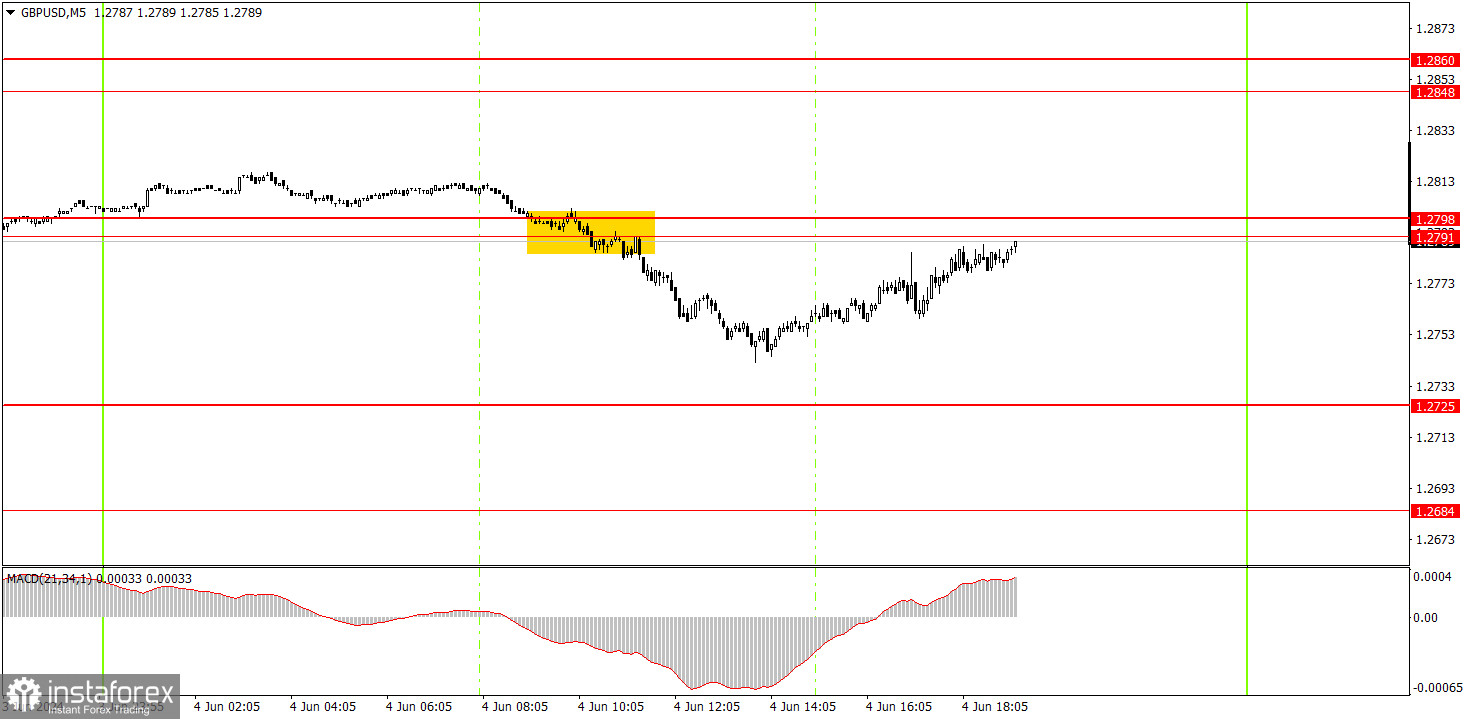
One sell signal was formed on the 5-minute timeframe. The price did not reach the target and the pair showed erratic movements. Beginners could open short positions upon overcoming the 1.2791-1.2798 area. These could have been closed after the release of the JOLTs report in the US, when it became clear that the dollar would not rise further... By evening, the pair's quotes returned to the 1.2791-1.2798 area, and today it may continue to rise above this area.
Trading tips on Wednesday:
On the hourly chart, the GBP/USD pair has great prospects for forming a downward trend, but the bullish correction remains intact. We're not particularly concerned about Monday's movements, even though it seemed strange for the dollar to suddenly collapse on a single report. However, we'd like to remind novice traders that the dollar doesn't fall solely when the US releases disappointing macro data. If there is no news at all, the pair simply stands still.
The British pound could rise on Wednesday, as the US ISM report set the tone for this week's trading. Today's trading signals can be found around the range of 1.2791-1.2798. You may consider opening long positions once the price consolidates above this area. Everything will depend on the upcoming US reports.
The key levels on the 5M chart are 1.2457, 1.2502, 1.2541-1.2547, 1.2605-1.2633, 1.2684, 1.2725, 1.2791-1.2798, 1.2848-1.2860, 1.2913, 1.2980. Today, the UK will publish the second estimate of its Services PMI data – a secondary report. The US docket will feature crucial reports on the ISM services index and the ADP's nonfarm employment change.
Basic trading rules:
1) Signal strength is determined by the time taken for its formation (either a bounce or level breach). A shorter formation time indicates a stronger signal.
2) If two or more trades around a certain level are initiated based on false signals, subsequent signals from that level should be disregarded.
3) In a flat market, any currency pair can produce multiple false signals or none at all. In any case, the flat trend is not the best condition for trading.
4) Trading activities are confined between the onset of the European session and mid-way through the U.S. session, after which all open trades should be manually closed.
5) On the 30-minute timeframe, trades based on MACD signals are only advisable amidst substantial volatility and an established trend, confirmed either by a trendline or trend channel.
6) If two levels lie closely together (ranging from 5 to 15 pips apart), they should be considered as a support or resistance zone.
How to read charts:
Support and Resistance price levels can serve as targets when buying or selling. You can place Take Profit levels near them.
Red lines represent channels or trend lines, depicting the current market trend and indicating the preferable trading direction.
The MACD(14,22,3) indicator, encompassing both the histogram and signal line, acts as an auxiliary tool and can also be used as a signal source.
Significant speeches and reports (always noted in the news calendar) can profoundly influence the price dynamics. Hence, trading during their release calls for heightened caution. It may be reasonable to exit the market to prevent abrupt price reversals against the prevailing trend.
Beginners should always remember that not every trade will yield profit. Establishing a clear strategy coupled with sound money management is the cornerstone of sustained trading success.


