


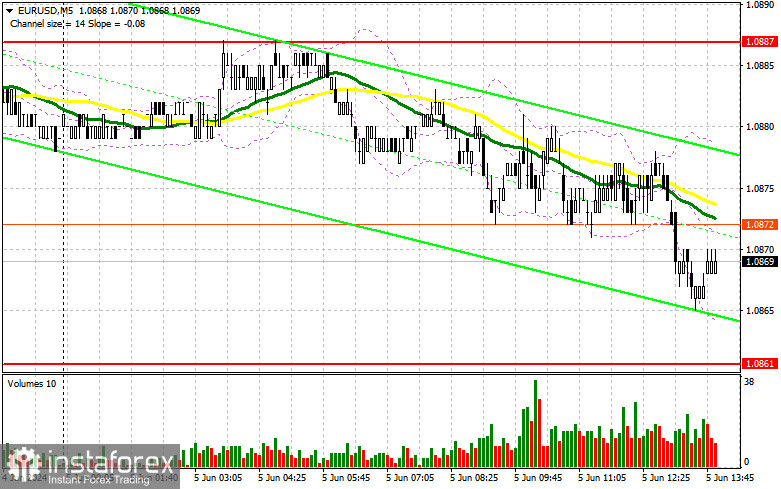
In my morning forecast, I drew attention to the level of 1.0861 and planned to make market entry decisions based on it. Let's look at the 5-minute chart and understand what happened there. Despite weak data from the Eurozone and the pair's decline, we could not reach the 1.0861 test. Low volatility ahead of important US statistics and tomorrow's ECB meeting seems justified. The technical picture for the second half of the day remains unchanged.
To open long positions on EUR/USD:
As observed in the second half of the day, weak service sector activity data from several Eurozone countries did not allow the euro to continue its rise. Given the upcoming important US statistics, pressure on the pair is expected to remain. Data on ADP employment change, the ISM Services PMI, and the Composite PMI, including manufacturing sector data, are expected. Strong statistics likely lead to the much-anticipated decline towards the 1.0861 area. However, only a false breakout formation there will provide an entry point for long positions, capable of returning EUR/USD to the level of 1.0887, just below which the moving averages are located, supporting sellers. A breakout and update from top to bottom of 1.0887 amid weak PMI statistics, similar to the figures for manufacturing activity at the beginning of the week, will strengthen the pair with a chance to surge to 1.0915. The furthest target will be the new monthly high of 1.0942, where I will take profit. In the event of a EUR/USD decline and lack of activity around 1.0861 in the second half of the day, trading will continue within the wide sideways channel, significantly increasing pressure on the euro and leading to a pair's fall. In this case, I will enter only after a false breakout formation around the next support at 1.0838. I plan to open long positions immediately on a rebound from 1.0813 with the target of an upward correction of 30-35 points within the day.
To open short positions on EUR/USD:
Sellers have a chance to regain market control, but good US statistics are needed for this. It's best to wait for a rise and a false breakout around the morning resistance of 1.0887, which could occur after a weak US services sector report. Only this will provide an entry point for new short positions with the prospect of the euro's decline and a retest of the support at 1.0861. A breakout and consolidation below this range and a reverse test from bottom to top will give another point to sell with a move towards the 1.0838 minimum, where I expect more active buyers to appear. The furthest target will be the minimum of 1.0813, where I will take profit. In the event of an upward movement of EUR/USD in the second half of the day and the absence of bears around 1.0887, buyers will have a chance to continue the pair's rise. In this case, I will postpone sales until the next resistance at 1.0915 is tested. I will also sell there, but only after an unsuccessful consolidation. I plan to open short positions immediately on a rebound from 1.0942 with the aim of a downward correction of 30-35 points.
Indicator signals:
Moving averages
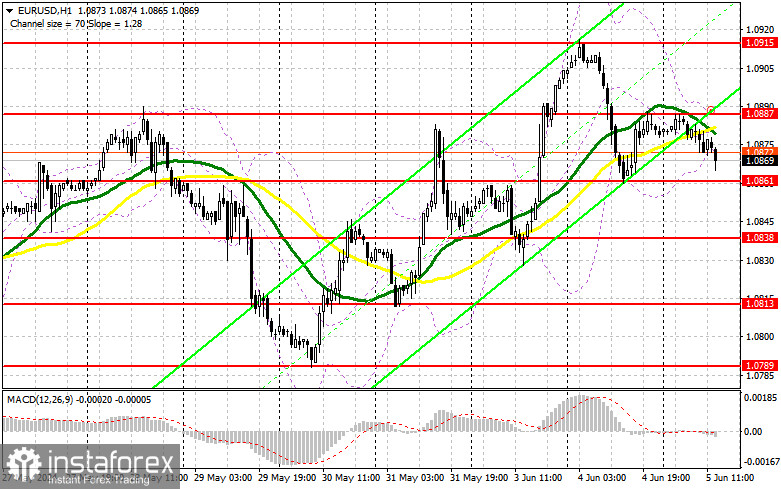
Trading is conducted below the 30 and 50-day moving averages, indicating market uncertainty.
Note: The author considers the period and prices of moving averages on the H1 hourly chart and differs from the general definition of classic daily moving averages on the D1 daily chart.
Bollinger Bands
In case of a decline, the lower boundary of the indicator, around 1.0866, will act as support.
Indicator descriptions:
- Moving average (MA): Averages volatility and noise to determine the current trend. Period 50. Marked in yellow on the chart.
- Moving average (MA): Averages volatility and noise to determine the current trend. Period 30. Marked in green on the chart.
- MACD (Moving Average Convergence/Divergence): A convergence/divergence indicator of moving averages. Fast EMA period 12. Slow EMA period 26. SMA period 9.
- Bollinger Bands: A volatility indicator with a period of 20.
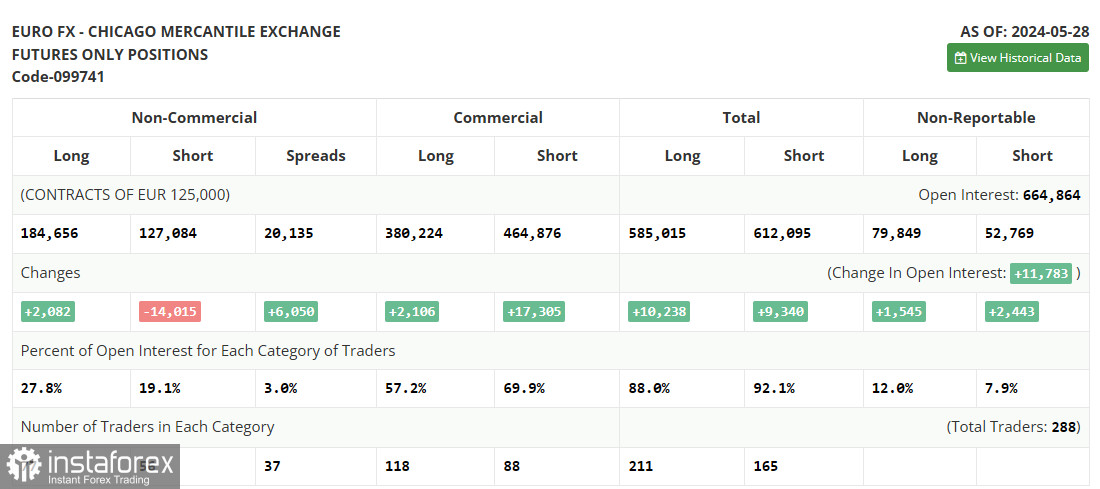
- Non-commercial traders: Speculators such as individual traders, hedge funds, and large institutions that use the futures market for speculative purposes and meet certain criteria.
- Non-commercial long positions: The total long open position of non-commercial traders.
- Non-commercial short positions: The total short open position of non-commercial traders.
- Total non-commercial net position: The difference between short and long positions of non-commercial traders.


