EUR/USD

Higher timeframes
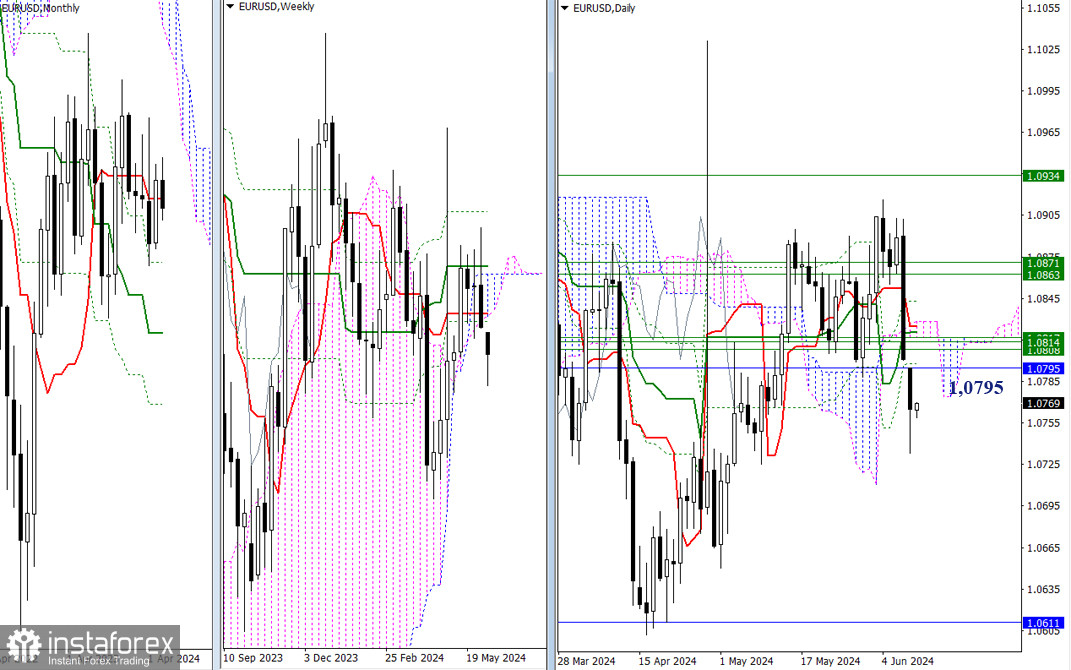
Yesterday, the bears managed to continue the downward movement, but by the end of the day, a slowdown was observed, resulting in a long lower shadow on the daily candle. A sustained decline would bring the bears' focus back to the monthly support at 1.0611. If the price continues the slowdown that started yesterday, the pair will face a resistance area (1.0795 - 1.0829), where several significant levels of higher time frames from different time intervals combine their strength and influence.

H4 – H1
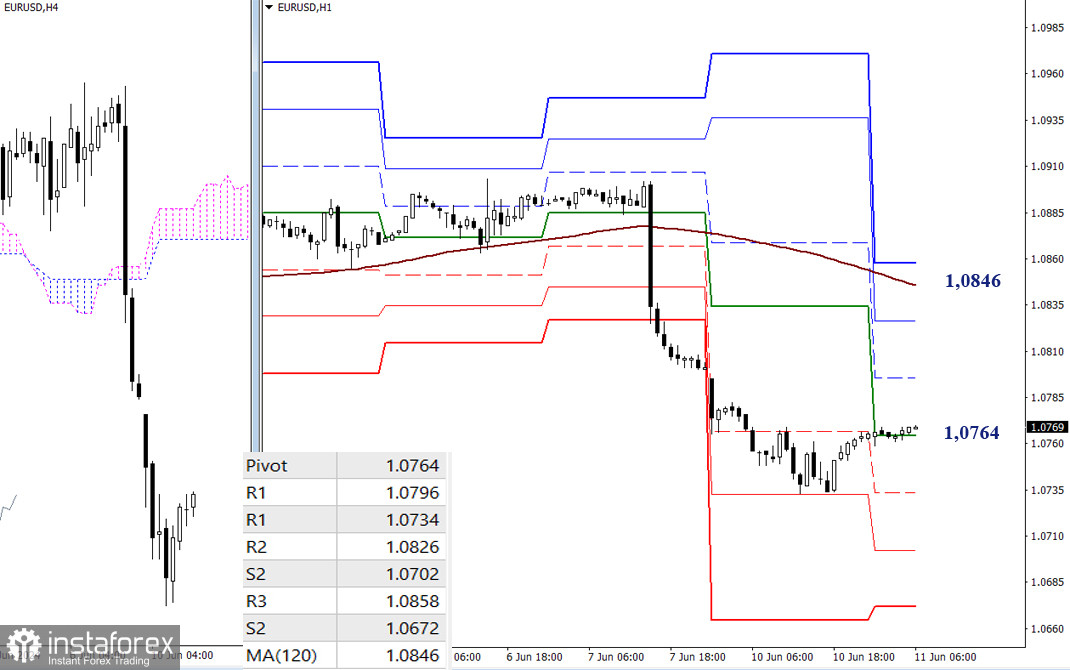
A corrective rise is emerging and developing on the lower time frames. The current attraction is the central Pivot level of the day (1.0764). The key level for developing a correction is the weekly long-term trend, which is currently located at a significant distance from the price chart (1.0846). This level determines the current balance of power, and consolidating above this level and its reversal can change who is in control of the market. On the way to this trend, two additional resistances of the classical Pivot levels can be found at 1.0796 and 1.0826. If the correction ends and the price resumes the decline, then today the market will focus on passing the supports of the classical Pivot levels (1.0734 - 1.0702 - 1.0672).
***
GBP/USD

Higher Timeframes
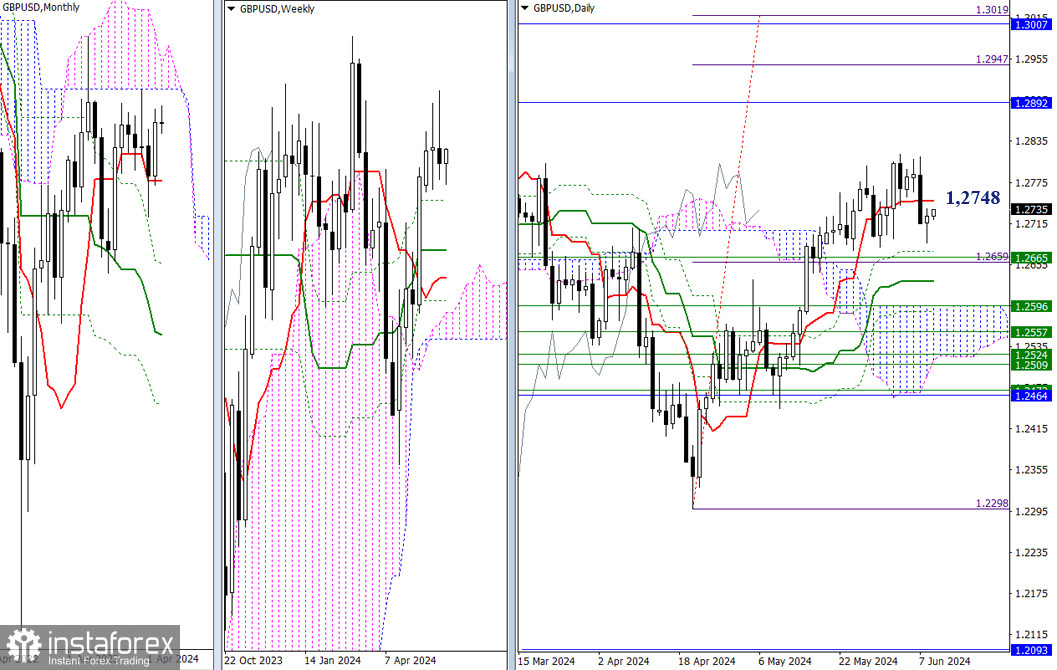
Yesterday, the price stopped falling. A retest of the daily short-term trend (1.2748) is possible. If the bulls regain their positions and the upward trend resumes (1.2816, the peak of the correction), the bullish targets will be the monthly cloud (1.2892 – 1.3007) and the daily target for breaking the Ichimoku cloud (1.2947 – 1.3019). A bearish scenario will direct the market towards a broad support area. The nearest supports can currently be found at the 1.2674 – 1.2631 range (daily cross levels) and 1.2665 (weekly Fibo Kijun).

H4 – H1
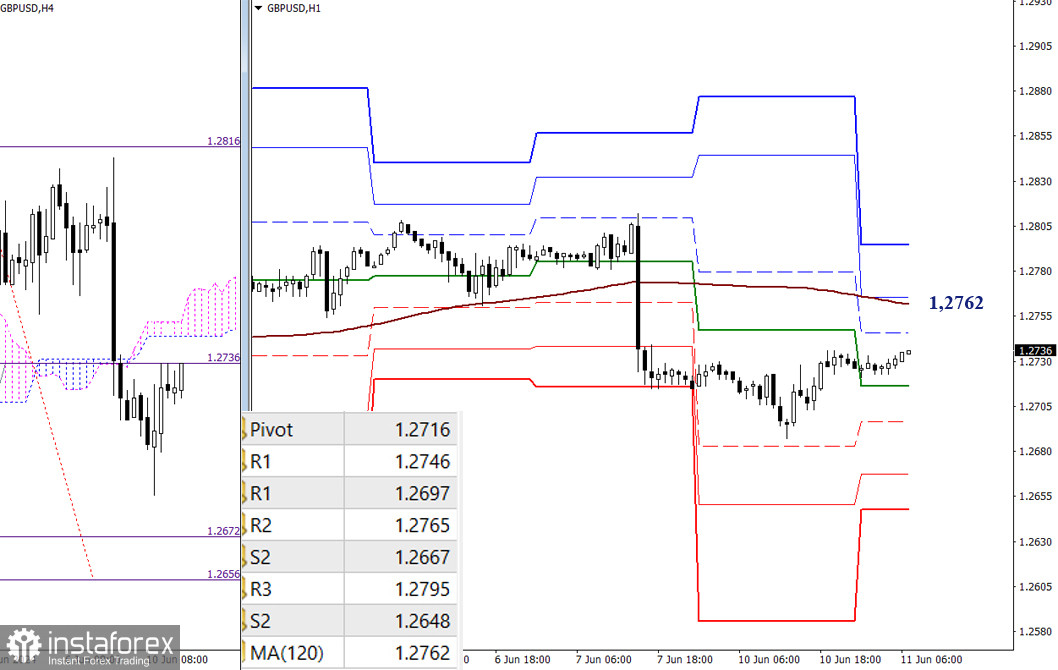
The bears have the main advantage, but the bulls are currently restoring their positions. The outcome of testing the weekly long-term trend (1.2762) will determine the scenarios for the near future. Working above the trend implies strengthening bullish sentiments. The next bullish targets are the resistances of the classical Pivot levels, which are 1.2765 and 1.2795. If the bears become active and the decline resumes, the intraday supports of the classical Pivot levels (1.2716 – 1.2697 – 1.2667 – 1.2648) will come into play.
***
The technical analysis of the situation uses:
Higher timeframes - Ichimoku Kinko Hyo (9.26.52) + Fibonacci Kijun levels
Lower timeframes - H1 - Pivot Points (classic) + Moving Average 120 (weekly long-term trend)


